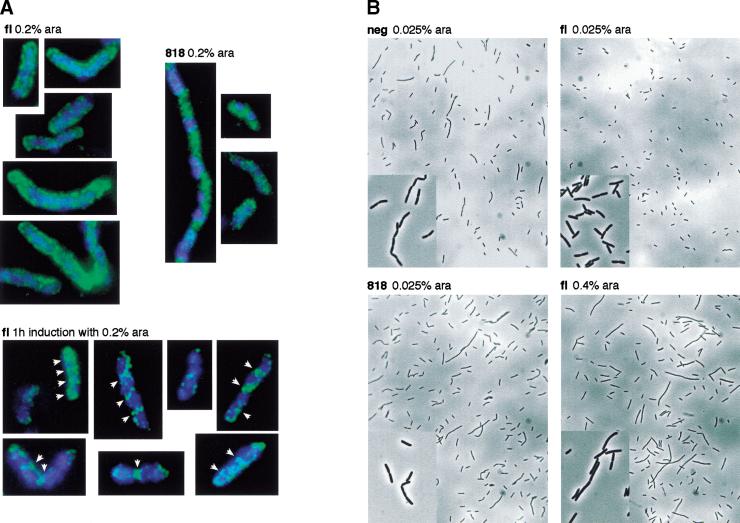
Figure 2.
(A) Cellular distribution of fl and 818 FtsK proteins. Induction with arabinose (0.2%) was for ∼25 generation in FtsKc− (DS9041) cells (top) or for 1 h in FtsKc+ (DS941) cells (bottom). The localization of the DNA and of the FtsK proteins is shown in blue and green pseudocolors, respectively. White arrows indicate septum ring-like structures. (B) Morphology of FtsKc− cells expressing various amounts of fl or 818 FtsK proteins or carrying a control expression vector (neg).

