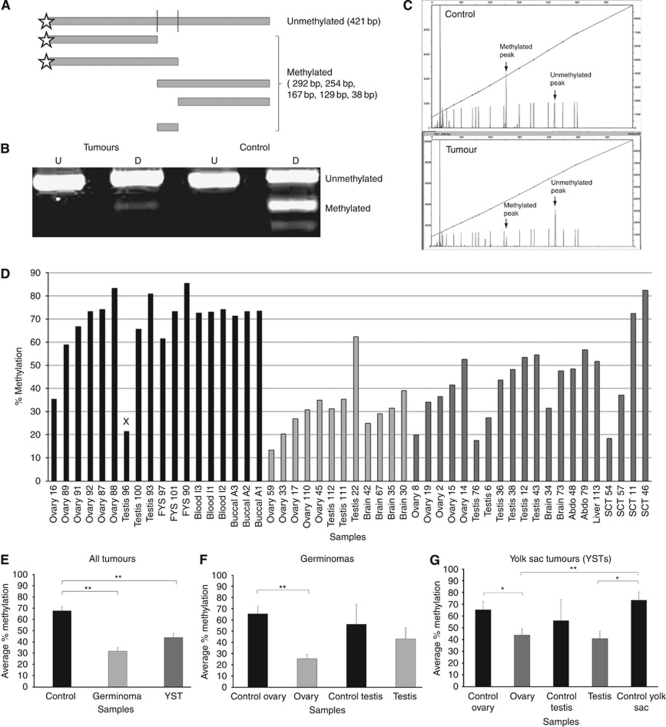
Figure 1.
Combination of bisulphite and restriction analysis (COBRA) of LINE-1 element methylation. (A) Diagram showing predicted digestion products. (B) Illustration of undigested (U) and digested (D) PCR products from representative tumour and control samples. (C) Example of GeneScan data from a representative control and tumour samples. (D) Percentage methylation levels of LINE-1 elements from individual samples as determined by GeneScan quantification. (E–G) Comparisons between tumour and control groups of samples showing that LINE-1 elements are significantly hypomethylated in all tumour groups as compared with controls, except where testicular tumours were compared with normal testes samples. However, the latter appears to reflect one of the three testicular control samples having a very low methylation value (x in D). *P<0.05, **P<0.01.

