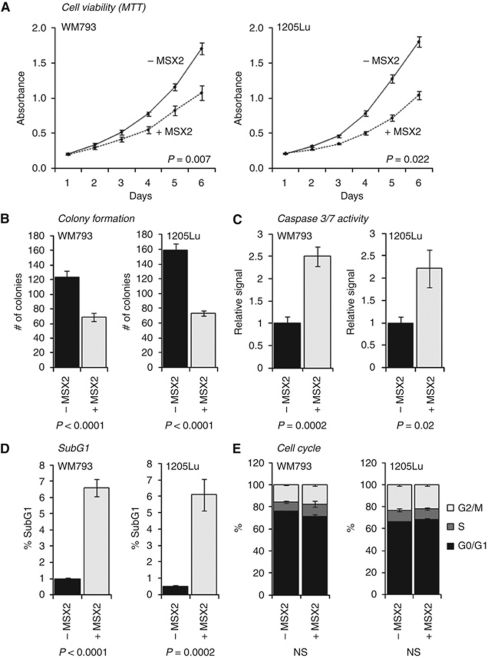
Figure 2.
Functional characterisation of DOX-induced (+MSX2) vs non-induced control cells (−MSX2) in two-dimensional cultures of WM793 and 1205Lu cells. (A) Evaluation of cell viability over time using MTT assays. Significance was generated from the average signal change between consecutive days in three independent experiments. (B) Determination of clonogenic cell survival. (C) Assessment of Caspase 3/7 activation using a bioluminescence-based Caspase-Glo 3/7 assay system. Luminescence readings were normalised to the total cell number and displayed relative to non-induced control cells. (D) SubG1 and (E) G0/G1, S and G2/M phases of the cell cycle as determined via PI staining and flow cytometric analysis. (For representative histograms, see Supplementary Figure 3.) All readings represent the average of three independent replicates. Error bars represent the standard error of the mean within all replicate experiments. Significance levels were determined using an unpaired, two-tailed Student's t-test. NS, not significant.

