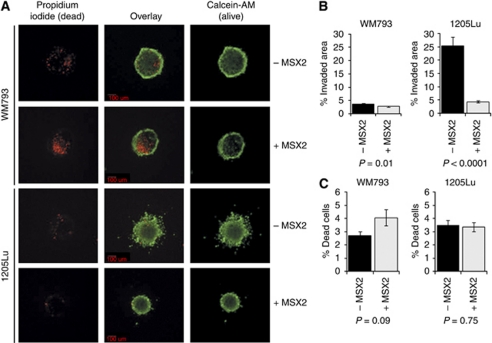
Figure 3.
Evaluation of the impact of DOX-induced MSX2 expression on the invasive capacity of 1205Lu cells in a three-dimensional spheroid invasion assay. (A) Representative fluorescent images of collagen implanted spheroids. Images were taken in × 4 magnification from the plane with highest visible cell dispersion of each spheroid using a spinning disc confocal microscope. Viable cells were stained with the green fluorescent dye, Calcein-AM, while dead cells appeared red upon PI incorporation. (B) Numerical analysis of invaded area as detailed in Supplementary Figure 1. (C) Assessment of the percentage dead cells relative to the spheroid area.

