Figure 6.
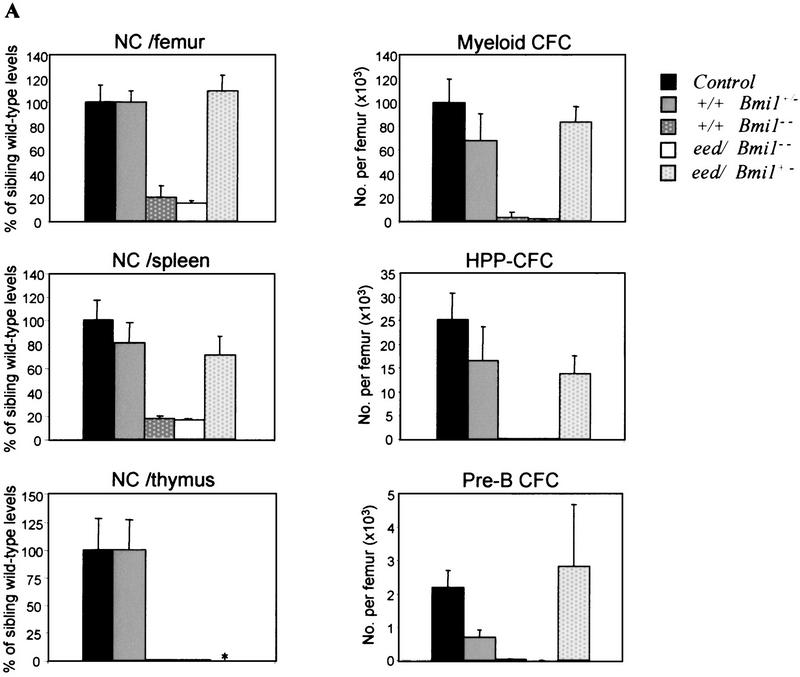
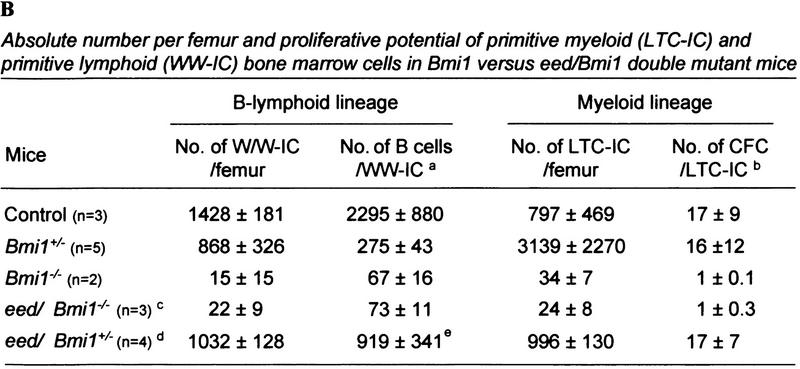
Hemopoietic parameters of Bmi1 mutant and eed/Bmi1 double mutant mice analyzed at 12–16 weeks of age. (A) Bone marrow, spleen, and thymic cellularity (left) and bone marrow CFC numbers (right) in control (n = 9), Bmi1+/− (n = 7), Bmi1−/− (n = 3), eed+/− Bmi1−/− (either eed3354/+ or eed1989/+; n = 3), and eed/Bmi1+/− (either eed1989/+ or eed1989/1989; n = 13) mutant mice. For clarity, the results for single C3Hf/101 × FVB/N eed mutant mice were excluded from this table because the data are superimposable to that of the C3Hf/101 eed mutant animals presented in Fig. 2B. (B) Frequency and proliferative potential of primitive myeloid (LTC-IC) and primitive lymphoid (WW-IC) bone marrow cells in Bmi1 vs. eed/Bmi1 double mutant mice. All results shown in A and B represent mean values ± SD. (*) Not determined. (NC) Nucleated cells; (HPP-CFC) high proliferative potential–CFC. aAbsolute number of B220+ cells analyzed by FACS at day 21 of in vitro culture; reflects the proliferative potential of individual WW-IC. b Absolute number of CFC per LTC-IC; reflects the proliferative potential of individual LTC-IC. c One eed1989/+ Bmi1−/− and two eed3354/+ Bmi1−/− mutant mice were included in this calculation because they had very similar phenotypes. d Includes both eed1989/+ Bmi1+/− and eed1989/1989Bmi1+/− double mutant mice because they had very similar phenotypes. e The values corresponding to the Bmi1+/− and eed/Bmi1+/− groups of mice are not overlapping, but because of an extreme value obtained in one eed/Bmi1+/− mouse (1980 B cells/WW-IC), they are not statistically different (P < 0.07, one-tailed Student's t-test with unequal variance).


