
Fig. 1.
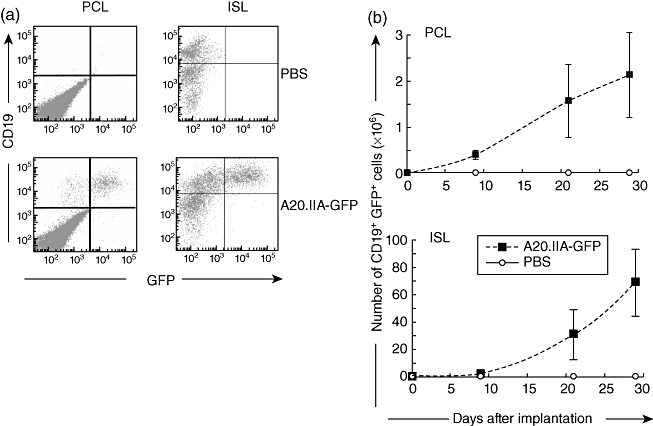
Kinetics of tumour growth in the brain and the spleen. (a) Flow cytometric analyses of double-positive green fluorescent protein (GFP+) CD19+ tumour cells 21 days after tumour or phosphate-buffered saline (PBS) injection into the brain [primary cerebral lymphomas (PCL)] or spleen [intrasplenic lymphoma (ISL)] of adult mice. (b) Kinetic analysis of tumour growth in mice implanted with 5 × 10⁴ (PCL) or 5 × 10⁵ (ISL) A20.IIA-GFP cells (dashed lines) or PBS (black line). Results from two independent experiments (n = 10).