
Fig. 3.
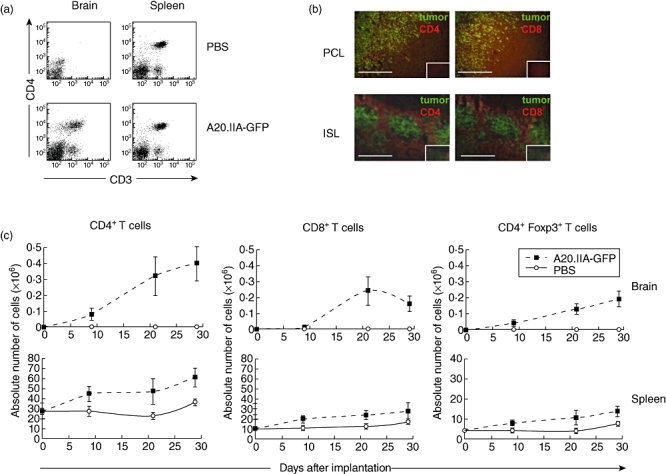
T cell enhancement in primary cerebral lymphomas (PCL) and intrasplenic lymphoma (ISL). (a) Flow cytometric analysis showing CD3+CD4+ staining in the PCL and ISL models 21 days after phosphate-buffered saline (PBS) injection or tumour implantation. (b) Immunohistological analyses of PCL and ISL slices showing green fluorescent protein (GFP+) tumour cells and CD4+ or CD8+ T lymphocytes stained in red. Isotypic controls are shown in the small inner boxes for each corresponding photomicrograph. (c) Flow cytometric analysis of the absolute number of CD3+CD4+ (left), CD3+CD8+ (middle) or CD3+CD4+forkhead box P3 (FoxP3+) (right) T lymphocytes infiltrating the brain or spleen over time in the PCL and ISL models (two independent experiments, n = 10).