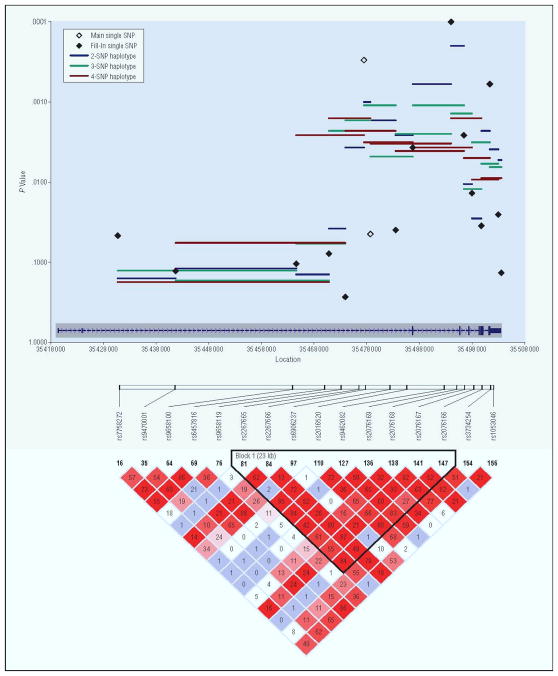
Figure 2.
Specific association results for PPARD. Plotted are empiric p-values for single-SNP TDT tests (black diamonds) and 2- 3- and 4-SNP haplotype windows (blue, green and red solid lines). Diamonds representing the SNP results for the 2 SNPs in the main analysis are open and diamonds representing the SNP results for the 13 fill in SNP are closed. The exon structure of the gene is included at the bottom of the graph in blue. The LD plot is shown below the graph with r2 values in the diamonds and the corresponding LD blocks42.

