
Figure 5.

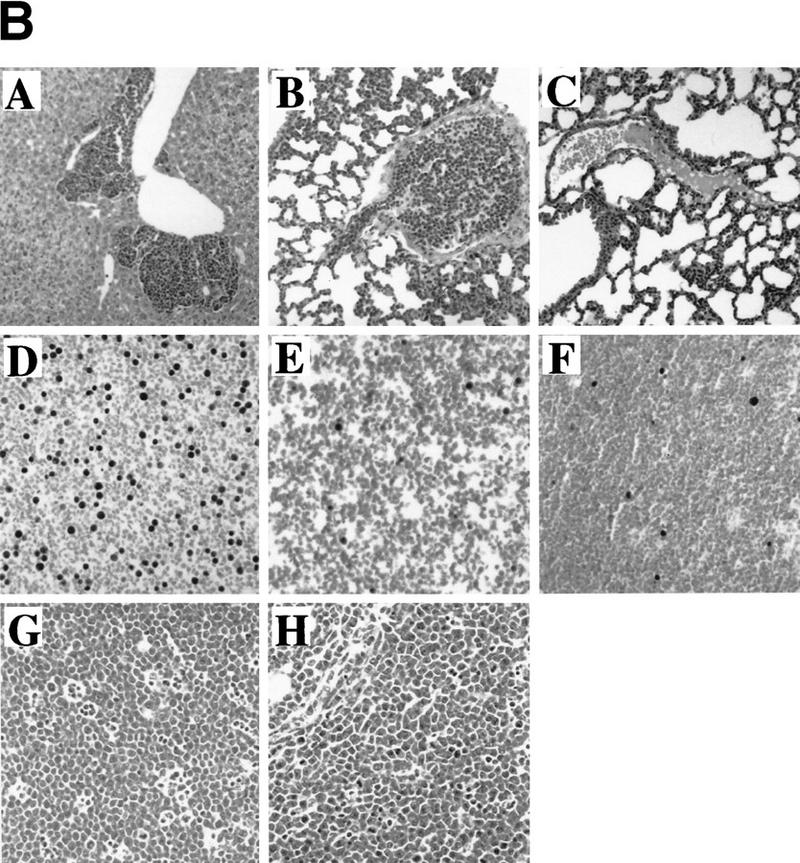
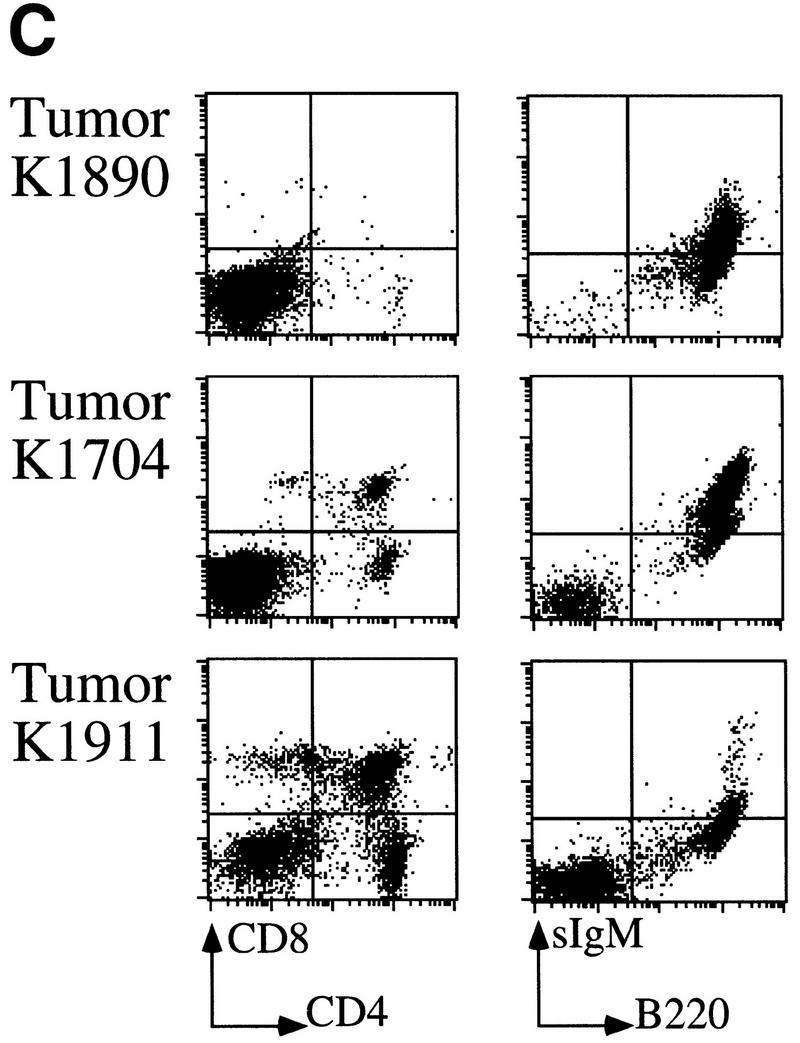

Severe acceleration of lymphomagenesis in Eμ–myc;ink4a–ARF+/− mice. (A) Eμ–myc;ink4a–ARF+/− mice quickly die of aggressive B-cell tumors. Kaplan-Meier survival plot of Eμ–myc; ink4a–ARF+/− mice and Eμ–myc mice. (B) Haematoxylin-eosin-stained sections of tumors that arose in Eμ–myc;ink4a–ARF+/− and Eμ–myc mice and of blood from these and ink4a–ARF−/− mice. (A) Representative example of an Eμ–myc;ink4a–ARF+/− tumor invading the liver; (B) a blood vessel in the lung of an Eμ–myc;ink4a–ARF+/− mouse filled with tumor cells. (C) A representative example of a blood vessel in the lung of an Eμ–myc mouse, which is free of tumor cells; (D-F) blood of Eμ–myc;ink4a–ARF+/− (D), Eμ–myc (E), and ink4a–ARF−/− (F) mice. Note that in contrast to the Eμ–myc and ink4a–ARF−/− mice, the blood of Eμ–myc;ink4a–ARF+/− mice is highly leukemic. (G, H) A higher magnification of a representative example of tumors that arose in Eμ–myc;ink4a–ARF+/− (G) and Eμ–myc (H) mice. Note the presence of more pyknotic tumor cells, which are indicative of apoptosis, in Eμ–myc tumors compared to Eμ–myc;ink4a–ARF+/− tumors. Photographs were taken at 10-fold (A-C) and 20-fold (D-H) magnification. (C) Flow-cytrometric analysis of cell suspensions of three Eμ–myc;ink4a–ARF+/− tumors after staining for cell surface CD8, CD4, sIgM, and B220. (D) Southern blot analysis of ink4a–ARF status of genomic DNA isolated from normal liver (L) or tumor (T) tissue showing LOH of the ink4a–ARF locus in tumors arising in Eμ–myc;ink4a–ARF+/− (lanes 1) and CD2–myc;ink4a–ARF+/− (lanes 3) mice but not in CD2–myc (lanes 2) Eμ–myc (lanes 5) and Eμ–bmi-1;ink4a–ARF+/− (lanes 4) mice.