
Table 1.
Crystallographic data
| Preparation
|
Native
|
I-1a
|
I-1 + I-10‘a
|
||
|---|---|---|---|---|---|
| Data Collection and MIR Statistics | |||||
| Crystal and data set | A | A | B | A | B |
| Resolution (30.0 Å)b | 3.2 Å | 3.4 Å | 3.5 Å | 3.3 Å | 3.5 Å |
| Total (Unique) Reflections | 175486 (11803) | 124686 (8942) | 212021 (10180) | 151902 (10827) | 53730 (9067) |
| Completeness | 99.5% | 99.0% | 99.4% | 99.7% | 71.2% |
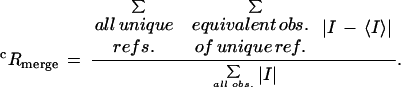
| Rmergec | 0.084 | 0.101 | 0.147 | 0.126 | 0.102 |
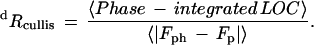
| Rcullisd | |||||
| centric | — | 0.727 | 0.642 | 0.604 | 0.585 |
| acentric | |||||
| Isomorphous | — | 0.682 | 0.572 | 0.598 | 0.540 |
| anomalous | — | 0.930 | 0.891 | 0.595 | 0.881 |
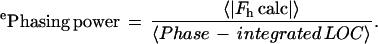
| Phasing Powere | |||||
| centric | — | 1.83 | 2.03 | 2.20 | 2.27 |
| acentric | |||||
| Isomorphous | — | 2.48 | 2.94 | 2.93 | 3.07 |
| Anomalous | — | 1.24 | 1.50 | 1.26 | 1.51 |
| Refinement | |||||
| Rworkf (30.0–3.2 Å) | 0.260 | ||||
| Rfreef (30.0–3.2 Å) | 0.326 | ||||
| rms deviation in bond lengths (protein/DNA): | 0.007 Å/0.006 Å | ||||
| rms deviation in bond angles (protein/DNA): | 1.395°/1.222° | ||||
| rms in the difference of B factors between bonded atoms: | 3.8 Åb | ||||
a
Native data collected at NSLS. All other data collected with a rotating anode source (Rigaku and MSC Corp.). All data collected on RAXIS-IV detectors (MSC) and reduced with the HKL suite of programs (Otwinowski and Minor 1997). Derivatives were prepared by substitution of thymine bases with 5-iodo-uracil in the octamer element either at position 1 or at position 1 and 10 (numbering as in Fig. 1B).
b
Reflects highest resolution for which at least 50% of the reflections satisfy I > 2σI.
 |
 |
 |
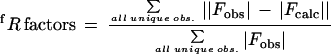 |
for reflections in the working (Rwork) or test (Rfree) data sets. Test set represented 10% of the total number of reflections selected at random. R factors were calculated with the bulk solvent model.