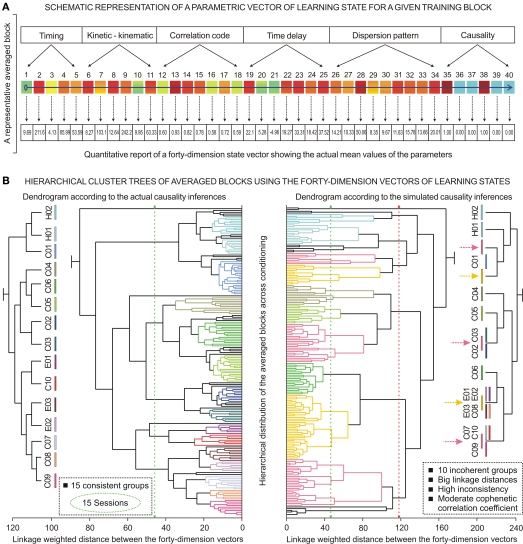
Figure 10.
(A) Schematic representation of a parametric vector corresponding to the learning state for a given training block. The diagram illustrates the qualitative definition of a 40-dimension state vector formed by 5 timing parameters (from 1 to 5, see Figure 3A), 4 kinetic neural commands (from 6 to 9, see Figure 3B), 2 kinematic variables (10 and 11, Figure 3B), 7 correlation code parameters (from 12 to 18, see Figure 4A), 7 time delays (from 19 to 25, Figure 6B), 9 dispersion patterns (from 26 to 34, Figures 5A and 6A, and Table 3), and finally 6 directional and causality indices (from 35 to 40, Figures 8 and 9). A color map representation of the parametric vector (the horizontal blue arrow) is also illustrated. Note the alternation of ranges of colors describing in qualitative and quantitative terms a functional state of the cerebellar–Mn pathway during motor learning. (B) Hierarchical cluster trees of averaged blocks using the 40-dimension vectors of learning states collected across habituation (H01–H02), conditioning (C01–C10), and extinction (E01–E03) sessions. The dendrograms illustrate the hierarchical distributions of the averaged blocks of trials across the classical conditioning and in accordance with both actual (the left-hand dendrogram, D1) and simulated (the right-hand dendrogram, D2) causality inferences. Each bar at the bottom of the dendrograms represents an averaged conditioning block. The linkage-weighted distances between the vectors are represented on the x-axes in arbitrary units. The comparison depth was of 16 levels to both sides of the objective level, and the clusters were formed without specifying the maximum number of clusters. The y-axes represent, as colored (not black) lines, the statistically significant clusters [D1, 15 significant clusters, 147 averaged blocks, F(14, 70, 132) = 36.1213, P < 0.01, Wilk's lambda = 0.09, with Nr = 5; D2, 10 significant clusters, 166 averaged blocks, F(9, 45, 156) = 2.4290, P < 0.05, Wilk's lambda = 0.26, with Nr = 5]. The black lines represent the averaged blocks (33, in D1; 14 in D2) that fall into the remaining statistically non-significant clusters (16 in D1; 4 in D2). According to the left-hand dendrogram D1 (for the actual causality inferences), the 15 significant clusters corresponded to 147 averaged blocks distributed in the 15 experimental sessions during the delay conditioning paradigm (H01–H02 = 19, C01–C10 = 108, and E01–E03 = 20 blocks). Here, notice a coherent nodal distribution (see the vertical colored bars in the left-hand panel) in correspondence with a proper trend in the evolution of the conditioning process. However, for the right-hand dendrogram D2 (simulated causality inferences), the total number of significant clusters was of 10 groups – i.e., an insufficient number of groups to match with the 15 conditioning sessions. Note that in D2 the clusters were obtained with evident linkage alterations that affect the typical and sequential temporal distribution of training blocks (see the yellow and pink horizontal bars) and sessions (see the vertical colored bars in the right nodal distribution) along the conditioning process. The green and red vertical dashed lines indicate the threshold linkage distances (46.57 and 117.94 units for D1 and D2, respectively) for these hierarchical cluster distributions.

