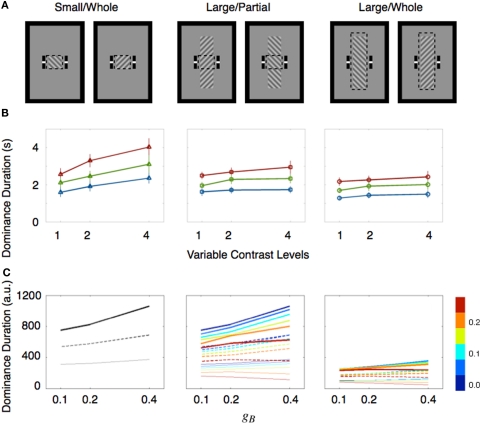
Figure 2.
Size dependent rivalry dynamics. (A) Stimulus conditions are illustrated. Observers report the perceptual state within the monitoring region which is depicted with dashed boxes. These dashed boxes were not shown during the experiments. (B) Mean dominance durations of the ipsilateral stimulus are plotted as a function of the contrast of the ipsilateral stimulus. The contrasts are represented as multiples of the lowest contrast level. The contrast values of the contralateral stimulus (expressed as multiples relative to the lowest value) are drawn with three separate lines (red line for 1X; green line for 2X; blue line for 4X). Error bar equals ± 1 SE. (C) Mean dominance durations (arbitrary unit) of simulated binocular rivalry are shown as Figure 2B in which contrasts of two rival stimuli were manipulated with potential landscape parameters gA and gB. Three distinct line styles indicate the dominance durations at a given gA (thick line for gA = 0.1; dotted line for gA = 0.2; thin gray line for gA = 0.4). Strength of spatial interactions were manipulated with the coupling strength parameter represented by different colors shown in the color bar at right. These figures are reproduced from Kang et al. (2009), with permission from Journal of Vision.

