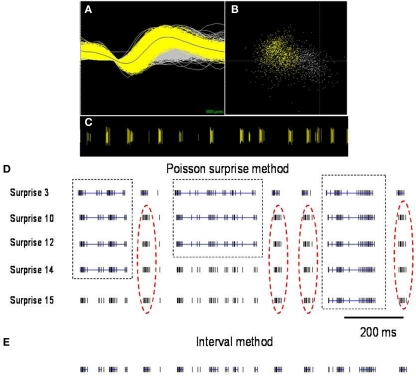
Figure 2.
Comparison of burst detection using the Poisson surprise and interval methods. (A) Spike discharge activity (yellow) superimposed on background noise (gray) from a representative neuron in GP of a dystonic rat (B). PCA analysis highlights the neuronal cluster (yellow) from the background (gray). (C) Raster display highlights the representative distinct burst clusters. Each vertical line represents an action potential. (D) Using lower surprise values, the Poisson surprise method wrongly classifies adjacent burst periods as one single burst (dashed boxes) and with higher surprise values, obvious bursts are rejected by the algorithm (red dashed oval). (E) The interval method provides greater reliability for defining individual burst periods. Blue lines indicate bursts detected in the spike trains using the two illustrated burst detection methods.

