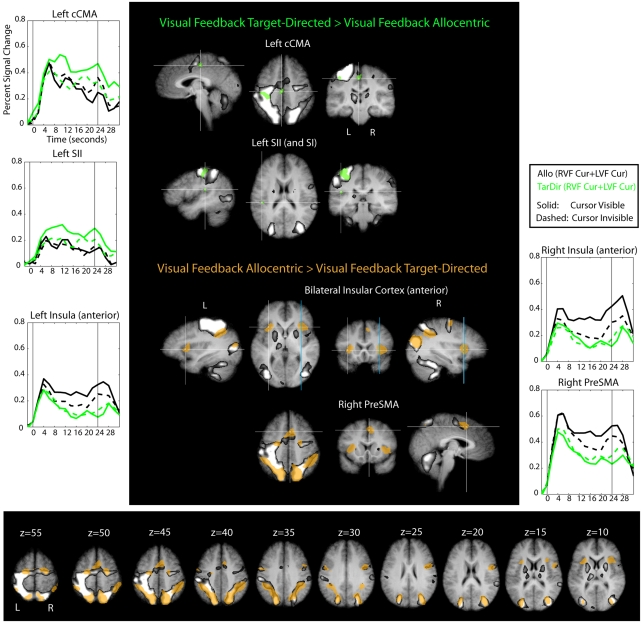
Figure 9.
Results of the conjunction “Visual Feedback Target-Directed > Visual Feedback Allocentric” and “Visual Feedback Allocentric > Visual Feedback Target-Directed” (Table 1) overlaid on subject’s average Talairach-brain (n = 14). It is evident that visual feedback leads to different patterns of activation in target-directed and allocentric movement tasks. Statistical thresholds (p < 0.0025) were those applied to each of the component contrasts in the conjunction. Probability of type-I errors in the resulting activation map was controlled using cluster size thresholds. Upper panel: brain areas that are more active during target-directed or allocentric visual feedback conditions are denoted in green and brown, respectively. Also shown is the “shared sensory–motor network” (gray) and time courses of areas denoted in green and brown that do not overlap with the “shared sensory–motor network.” For stereotactic coordinates of activation foci see Table 3. Lower panel: slice views to illustrate extent of “allocentric visual feedback areas” (brown) and relative arrangement with respect to the “hared sensory–motor network” (gray).

