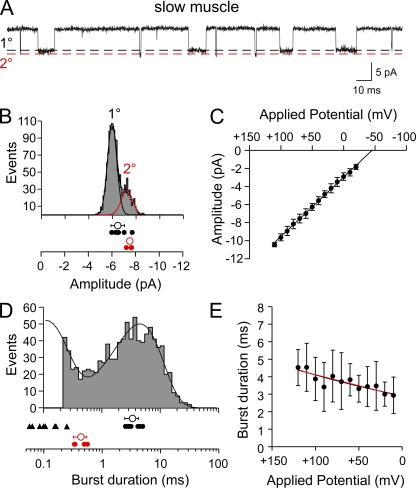
Figure 4.
Single-channel ACh-activated currents from slow skeletal muscle of 72-hpf larval zebrafish. (A) A sample ∼0.25-s trace showing two amplitude classes of ACh-activated channels (300 nM) recorded from a cell-attached patch at +50 mV applied potential. The open channel levels for the primary (1°) and secondary (2°) amplitude classes are indicated by the dashed lines. (B) The amplitude frequency histogram for a single recording with two amplitude classes (1° and 2°) at +50 mV applied potential. The mean values for each class are indicated for individual recordings (filled symbols) along the overall mean ± SD (open symbols) below the histogram. (C) The current–voltage relations for the pooled 1° openings. Each symbol represents the mean amplitude ± SD values of all patches (n = 8) for each applied potential. (D) A burst-duration frequency histogram from a single recording fit to the sum of two exponential functions. Only the 1° amplitude class was included in the distribution. The mean values for the brief (filled triangles) and long (filled circles) mean burst duration for the 1° class are indicated along with the overall mean ± SD (open symbols). The 2° class was fit separately to a single exponential (not depicted), and the individual mean values for burst duration for each recording (red filled circles) are indicated along with the overall mean ± SD (red open symbol). (E) The relationship between applied potential and mean burst duration is shown for all 1° class openings fit with linear (black) and exponential (red) curves. Each symbol represents the mean ± SD (n = 10 recordings).

