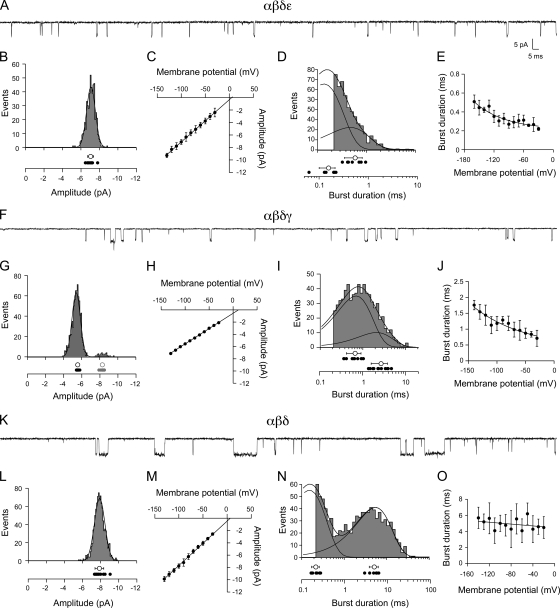
Figure 6.
Functional properties of ACh-activated single-channel currents from Xenopus oocytes expressing αβδε (A–E), αβδγ (F–J), and αβδ (K–O) subunit RNA. (A) Sample recording from a patch expressing αβδε at −100 mV. (B) A representative amplitude histogram for one recording, with individual mean values for all recordings (filled circles; n = 12) shown below along with the overall mean ± SD (open circle) at −100 mV. (C) The cumulative current–voltage relations for eight recordings. (D) A representative burst-duration histogram fit by the sum of two exponentials. The time constants for each exponential are indicated for each recording (filled circles; n = 7) along with the overall mean ± SD for all recordings (open circles) at −100 mV. (E) The relationship between burst duration and membrane potential for seven recordings fit to an exponential function. The voltage dependence corresponds to e-fold change per 156 mV over this range. (F) Sample recording from a patch expressing αβδγ at −100 mV. (G) A representative amplitude histogram from one recording showing a 1° (black) and 2° (red) amplitude class of openings. The individual mean values for 10 recordings (filled circles) are shown along with the overall mean ± SD (open circles) for each class at −100 mV. (H) The cumulative current–voltage relations for the primary class for eight recordings. (I) A representative burst-duration histogram fit by the sum of two exponentials. The time constants for each exponential are indicated for each recording (filled circles; n = 9) as well as the overall mean ± SD (open circles) at −100 mV. (J) The relationship between burst duration and membrane potential for four recordings fit to an exponential function. The voltage dependence corresponds to e-fold change per 141 mV over this range. (K) Sample recording from a patch expressing αβδ at −100 mV. (L) A representative amplitude frequency histogram from a single recording with the individual mean values for all recordings (filled circles; n = 13) along with the overall mean ± SD (open circle) at −100 mV. (M) The cumulative current–voltage relations for 11 recordings. (N) A representative burst-duration histogram fit by the sum of two exponentials. The individual time constants for each exponential are indicated for each recording (filled circles; n = 6) as well as the overall mean ± SD for all recordings (open circles) at −100 mV. (O) The relationship between burst duration and membrane potential for six recordings fit to an exponential function over the range of values shown yielding an e-fold change in burst duration per 769 mV.

