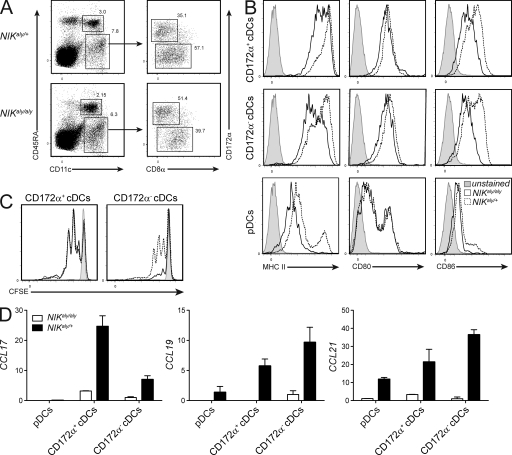
Figure 6.
NIKaly/aly thymic DCs show reduced APC capacity. (A) Flow cytometric analysis of thymic DC subsets from NIKaly/aly and control animals. pDCs are CD11cintCD45RA+, thymic resident DCs are CD11c+CD172a−, and thymic migratory DCs are CD11c+CD172a+. Numbers in the plots indicate the percentage of the respective DC subset of the total thymic DC fraction. (B) Expression analysis of MHCII, CD80, and CD86 on thymic DC subsets. Dotted lines represent heterozygous control DCs, solid lines NIKaly/aly DCs, and gray histograms unstained controls. (C) Proliferation of CFSE-labeled 2d2 CD4+ SP thymocytes after 3 d of co-culture with thymic migratory (left) and resident (right) DCs in the presence of 10 µg/ml MOG35–55. Dotted lines represent CFSE profile after stimulation with heterozygous control DCs, solid lines show NIKaly/aly DCs, and gray histograms show unstimulated cells. (D) RNA of FACS-sorted thymic DC subsets from NIKaly/aly and NIKaly/+ mice was transcribed into cDNA and analyzed by qRT-PCR for expression of different chemokines. Shown is the fold change in expression level compared with CD172α− NIKaly/aly cDCs, which was set to 1. Data in all panels are representative of three independent experiments. Error bars indicate SD.

