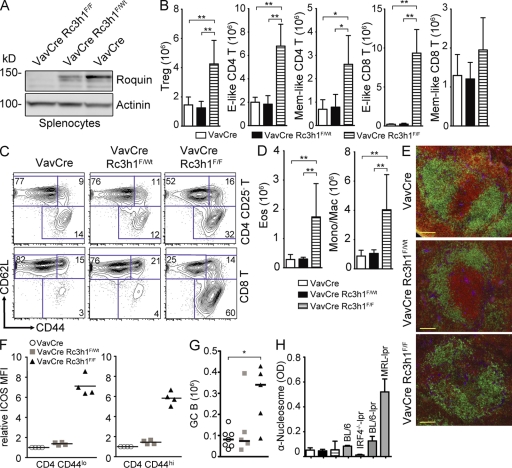
Figure 3.
Deregulation of immune homeostasis in the absence of Roquin in the hematopoietic system. (A) Western blot analysis to evaluate Roquin protein expression in splenocytes. (B and C) Absolute cell numbers (B) and representative contour plots (C) of splenic T cell (TCR-β+) subsets: effector (E)-like, CD44hiCD62Llo; and memory (Mem)-like, CD44hiCD62Lhi (n = 7–9); Treg cells, CD4+FoxP3+ (n = 3–5). Columns and error bars represent means ± SD calculated from the number of mice indicated. (D) Columns and error bars represent means ± SD of absolute cell numbers of eosinophils (Eos; Gr1intSiglecF+) and monocytic/macrophages (Mono/Mac; SiglecF−Gr1intMac1+) calculated from four to six mice per group. (E) Immunofluorescence of spleen sections: green, α-B220; red, α-CD3; blue, α-laminin. Bars, 100 µm. (F) Relative ICOS MFI of naive (CD44lo) and memory/effector-like (CD44hi) splenic CD4 T cells. Bars indicate medians. (G) Absolute cell numbers of germinal center (GC; B220+PNAhiFashiCD38lo) B cells. Bars represent medians calculated from five to seven mice per genotype. (H) Titers of serum autoantibodies against nucleosomes measured by ELISA (2–7 mo old) from 8–10 mice of the indicated genotypes. Sera from BL/6, IRF4−/−-lpr, BL/6-lpr, and MRL-lpr mice were used as positive or negative controls. Columns and error bars represent means ± SD. *, P < 0.05; **, P < 0.001; one-way ANOVA.

