Figure 2.
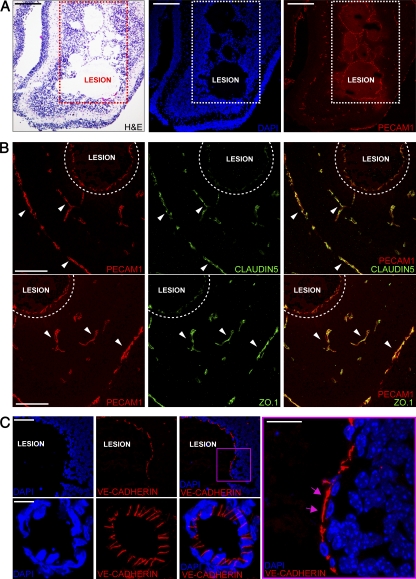
Ccm2 deletion alters AJ and TJ organization in CCM lesions. Analysis of cell–cell junctions in CCM2 malformations on frozen sections of iCCM2 brain. For all immunofluorescence experiments, cell nuclei are visualized with DAPI (blue). Data are representative of 3 independent observations (n = 5 in each group, from 2 different litters). (A) H&E staining (left) and confocal microscopy analysis showing vessels stained using anti-PECAM1 (red, right). (B) Co-staining of the vessels using PECAM1 staining (red) and the TJ components (green) using claudin-5 (top) and ZO.1 (bottom). Claudin-5 and ZO.1 are normally expressed in peri-lesion vessels (arrowheads), whereas they are strongly down-regulated in abnormally dilated and hemorrhagic vessels of the lesion (dotted area). (C) VE-cadherin staining (red) of the endothelium lining lesion and peri-lesion vessels. (right) Magnification of the boxed area. Pink arrows indicate VE-cadherin expressed outside of the junctions. Bars: 200 µm (A); 100 µm (B); 60 µm (C, top); 4 µm (C, bottom and right).

