Figure 5.
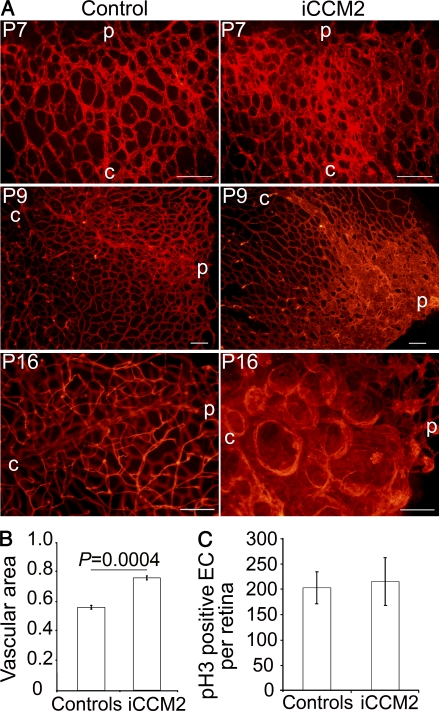
Natural history of the CCM lesions. (A) Retinal CCM lesion development from P7 to P16. The vasculature at the periphery of the retina on controls or iCCM2 animals is shown after isolectin-B4 staining. C, central retina; p, peripheral retina. Data are representative of at least 50 animals in each group, analyzed between P6 and P19. (B) Quantification of the vascular coverage at the venous leading edge of the plexus in the retina at P7. Data are expressed as vascular area ± SEM (isolectin-B4–positive area, relative to total retinal area analyzed; n = 4 in each group, from 2 different litter; 6–8 fields analyzed per retina). (C) Quantification of the EC proliferation in control or iCCM2 retinas at P6, assessed by total number of phospho-histone 3–positive ECs per retina ± SD (n = 6 in each group, from 3 different litters). Bars, 100 µm.

