Figure 3.

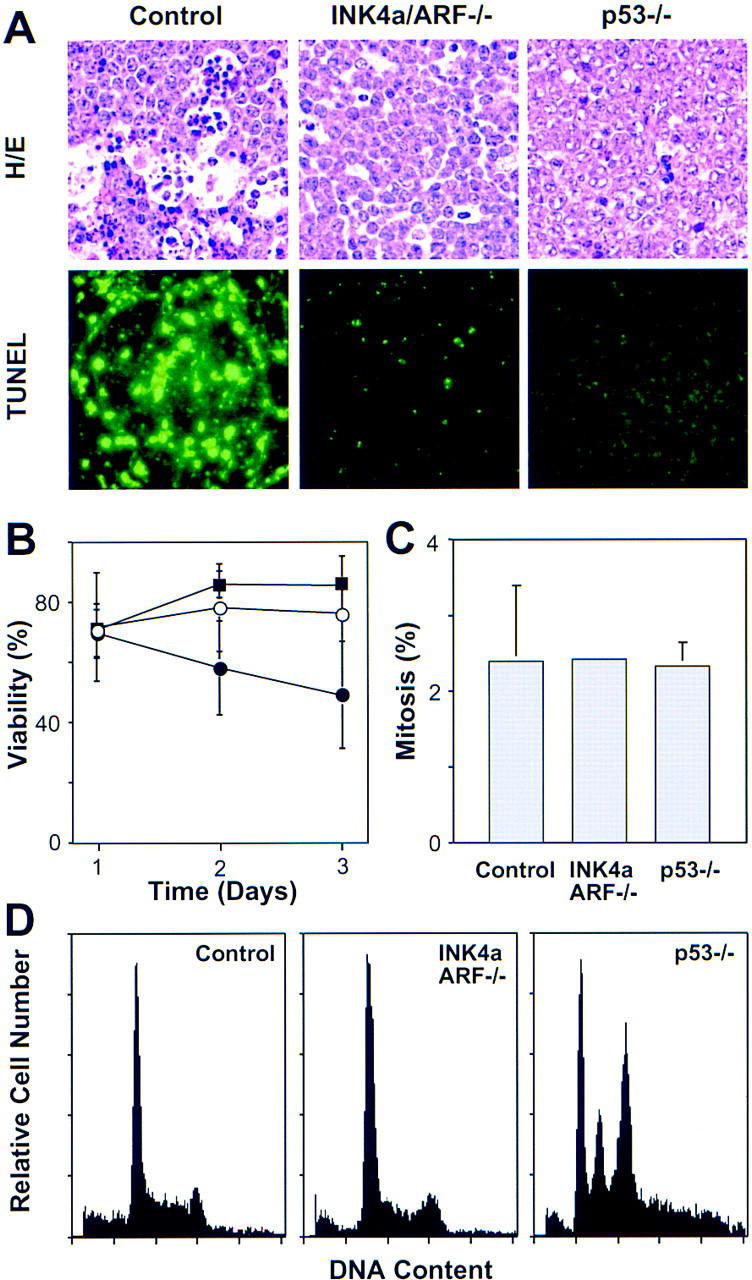
Analysis of apoptosis, proliferation, and chromosomal stability in Eμ–myc lymphomas. (A) Apoptosis in situ (lymph nodes) was visualized by HE staining and TUNEL. The reduced apoptotic rate observed in INK4a/ARF−/− tumors is consistent with a similar defect observed in the ocular lens of Rb−/−; INK4a/ARF−/− embryos (Pomerantz et al. 1998). (B) Viability of control (●), INK4a/ARF−/− (○), and p53−/− (█) lymphoma cells as measured by trypan blue exclusion after explanting onto feeder cells. (C) Proliferation as estimated by the percentage of mitotic figures in HE-stained lymphoma sections. (D) DNA content analysis of primary Eμ–myc lymphoma. The S-phase fractions of control (30.25% ± 8.31, n = 9) and INK4a/ARF−/− (29.98% ± 6.39, n = 10) were virtually identical, whereas subG1 fractions of control (3.26% ± 3.17) and INK4a/ARF−/− (0.30% ± 0.56) lymphomas were significantly different (P = 0.0097). Note that sub-G1 assessment recognizes only late apoptotic cells and gives lower estimates than TUNEL. Calculations of S-phase and sub-G1 fraction in p53−/− lymphomas were impossible due to aneuploidy. Representative profiles are shown. Note that low frequency of aneuploidy in control and INK4a/ARF−/− lymphomas (1 of 14 and 1 of 14, respectively) is consistent with the overall p53 mutation rate we observed in these tumors.
