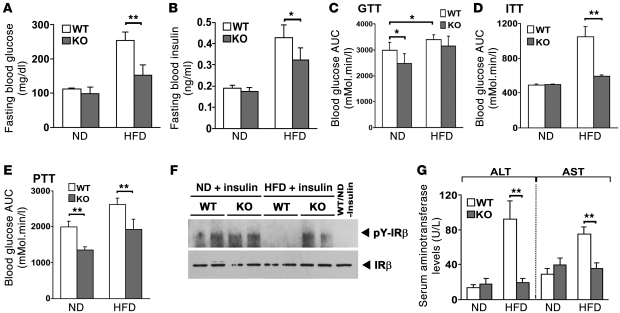
Figure 2. Parkin–/– mice are resistant to HFD-induced glucose intolerance and hepatic insulin resistance.
(A and B) Fasting blood glucose and serum insulin levels in Parkin+/+ and Parkin–/– mice. (C) GTT expressed as the AUC of blood glucose levels during the 2 hour study. (D) ITT expressed as AUC for blood glucose over 2 hours. (E) PTT expressed as AUC for blood glucose of 2 hours. (F) Assessment of phosphorylation of IRβ in liver following intraperitoneal insulin administration. Liver extracts were IP with IRβ antibody and the immunoblot performed with a phospho-tyrosine antibody. The far right lane shows protein expression in WT mice on the ND without insulin. (G) Serum aminotransferase levels. The mice were fed with ND or HFD for 6.5 weeks. Data are expressed as mean ± SD. *P < 0.05; **P < 0.01 versus controls (n = 4–6 per group).

