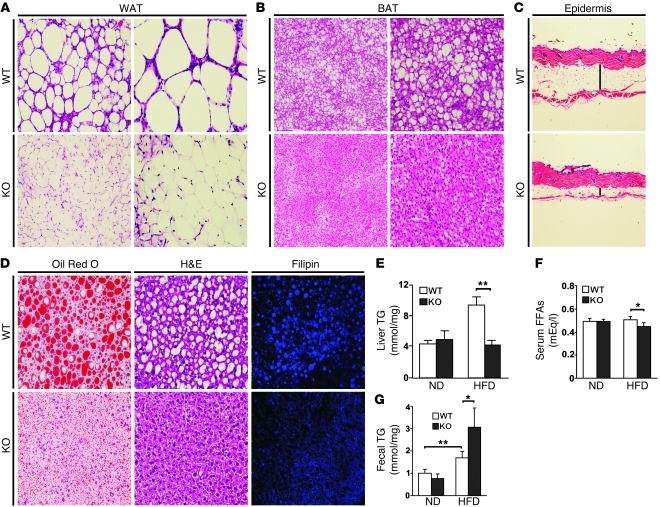
Figure 3. Parkin–/– mice are resistant to HFD-induced fat accumulation.
Tissue sections were analyzed after 6.5 weeks of the HFD. WAT (A) and BAT (B) were processed using H&E staining. The upper panels show Parkin+/+ (WT) mice and lower panels show Parkin–/– (KO) mice. Original magnification, ×10 (left panels); ×20 (right panels). (C) The skin epidermal thickness in transverse sections from Parkin+/+ and Parkin–/– mice (H&E staining). Vertical line shows the subcutaneous fat. (D) TG accumulation in liver sections by Oil Red O and H&E staining, and cholesterol levels by Filipin staining in Parkin WT and Parkin–/– mice. Original magnification, ×20 (left panels); ×20 (middle panels); ×40 (right panels).(E) Hepatic TG levels, (F) serum-free fatty acid levels, and (G) TG levels in the feces on the ND and HFD comparing the WT and KO mice. The feces from the mice fed a ND (n = 4) or HFD (n = 7) for 5 weeks were collected daily over a 3-day period. Lipids were extracted from the feces and TG measured using a colorimetric assay. Data are expressed as mean ± SD. Representative histological images are shown; similar results were acquired from 3–4 independent mice. *P < 0.05; **P < 0.01 versus controls (n = 4–7 per group).

