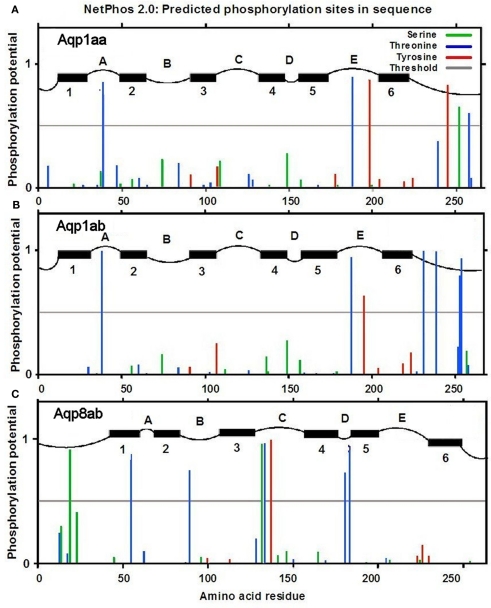
Figure 11.
Analysis of predicted serine, threonine and tyrosine phosphorylation sites in Aqp1aa (A), Aqp1ab (B), and Aqp8ab (C) (from NetPhos 2.0 server at www.cbs.dtu.dk; Blom et al., 1999). Black horizontal bars indicate predicted transmembrane domains with numbering below. Letters (A–E) indicate extracellular domains; letters (B–D) indicate cytosolic domains (from TMPred at www.ch.embnet.org; Hofmann and Stoffel, 1993).

