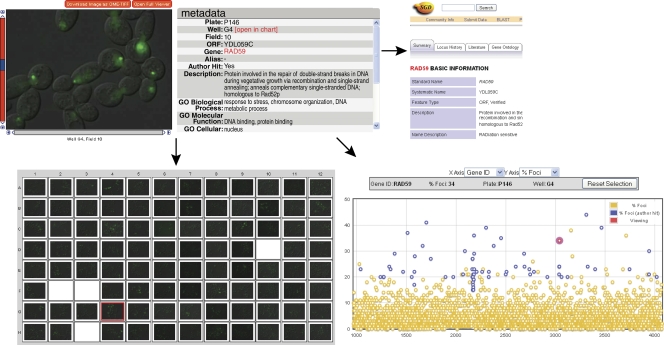
Figure 1.
The HCS interface of the JCB DataViewer provides interactive tools for the analysis of complete datasets from image-based screens. The miniviewer (top left) provides information for each gene in the screen through a zoomable and scrollable display of original multidimensional image data. It contains detailed metadata and a gene ontology (GO) summary, a link to a relevant external database (e.g., the Saccharomyces Genome Database [SGD]; top right), and a link to phenotypic scoring data for the complete screen in the chart view (bottom right). Within the chart view, hits designated by the screen authors are shown in blue, and the strain currently on display in the miniviewer is shown in red. The plate view (bottom left) shows the position of the strain of interest (red box) relative to other strains screened.

