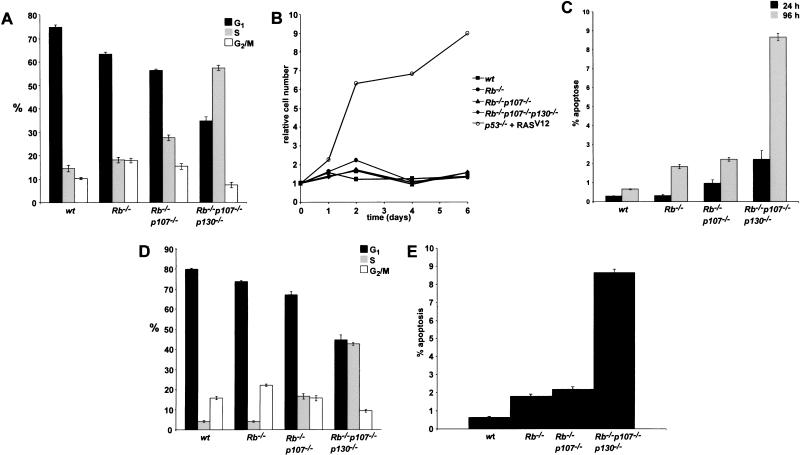
Figure 7.
Increased cell turnover in TKO MEFs under growth-inhibiting conditions. (A) Distribution of G1, S, and G2/M phases of indicated MEFs at 0.1% FCS. (B) Growth curves of indicated MEFs at 0.1% FCS. (C) Percentage of apoptotic cells in indicated MEF cultures at 0.1% FCS, 24 h (black), and 96 h (grey) after growth-factor depletion. Percentages were obtained by determing the sub-G1 population in a FL3A-log histogram. (D) Distribution of G1, S, and G2/M phases of indicated contact-inhibited MEFs. (E) Percentage apoptotic cells in contact-inhibited MEF cultures. Average values of three independent experiments are indicated in percentages. Error bars indicate standard deviations from the mean (A,C,D,E).

