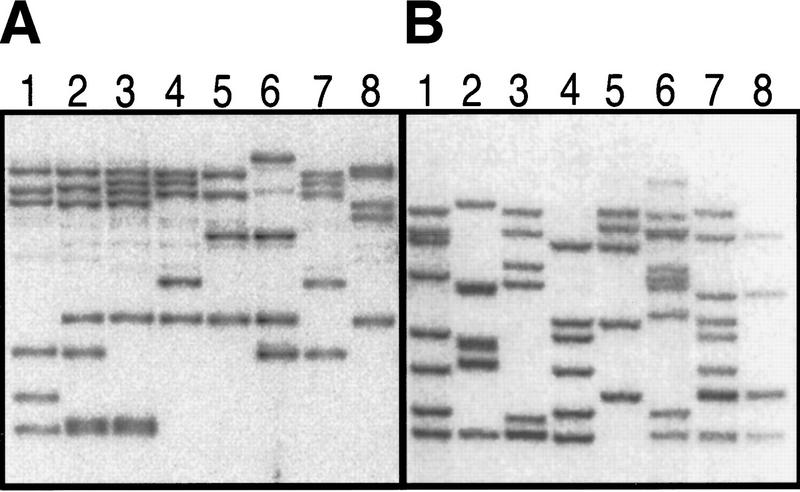
Figure 2.
Southern analysis of the top eight fish from two different F1 families. Note that in family A, the majority of the insertions are the same from fish to fish, implying that most of them came from the same germ cell from one of the founders. In this case, we would keep fish 3 (seven inserts), fish 6 (three new inserts), and no others, as none would give more than two new inserts. Family B has much greater diversity of inserts. In this case, we would keep fish 6 (nine inserts), fish 7 (seven new inserts), and fish 2 (five new inserts).

