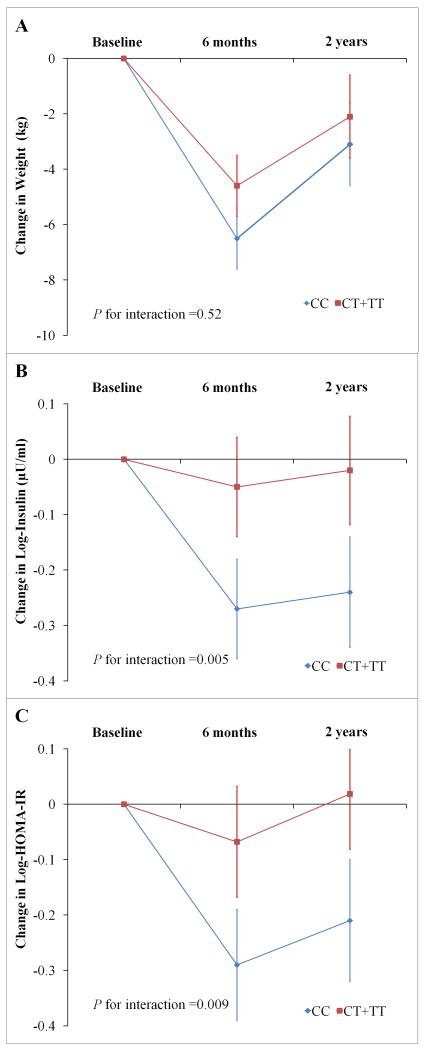
Figure 1. Genotype Effect of IR1 rs2943641 on Trajectory of Changes in Weight, Fasting Insulin and HOMA-IR in Participants Assigned to the Highest-carbohydrate Diet overall 2 Years.
A: changes in weight, data were included for 187, 162 and 158 participants at baseline, 6 months and 2 years, respectively. B: changes in fasting insulin, data were included for 185, 150 and 135 participants at baseline, 6months and 2 years, respectively. C: changes in HOMA-IR, data were included for 185, 150 and 135 participants at baseline, 6months and 2 years, respectively. Data are means ± SE after adjustment for age, sex and ethnicity. P values were tested for the interaction between genotype and intervention time. Insulin and HOMA-IR were log-transformed before analysis.

