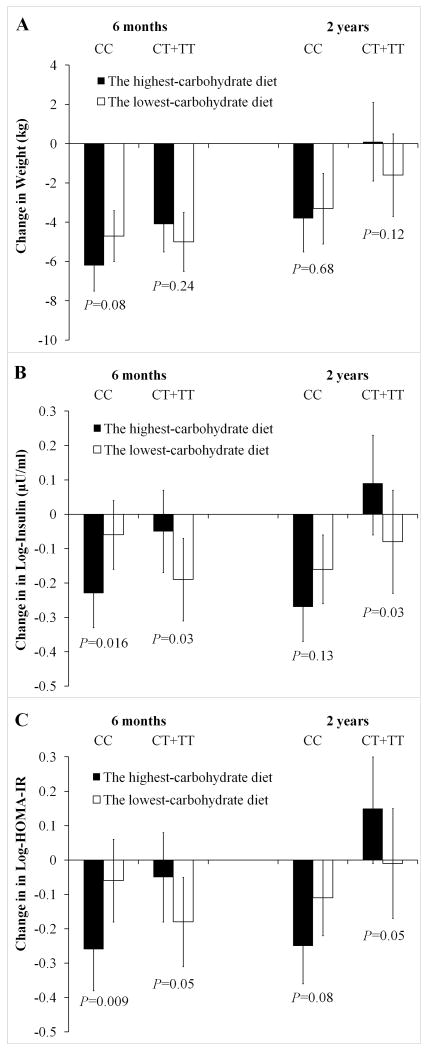
Figure 2. Effect of the Highest-carbohydrate and the Lowest-carbohydrate Diets on Changes in Weight (A), Fasting Insulin (B) and HOMA-IR (C) by IRS1 Genotypes at 6 Months and 2 Years.
Data are means ± SE and P-values are for comparisons between the 2 extreme diet groups, after adjustment for age, sex and ethnicity. Insulin and HOMA-IR were log-transformed before analysis.

