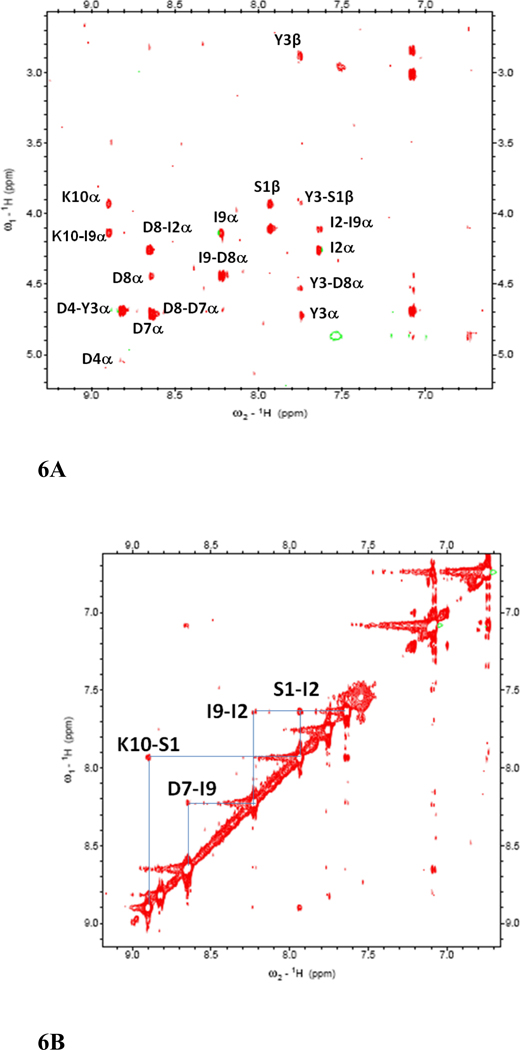
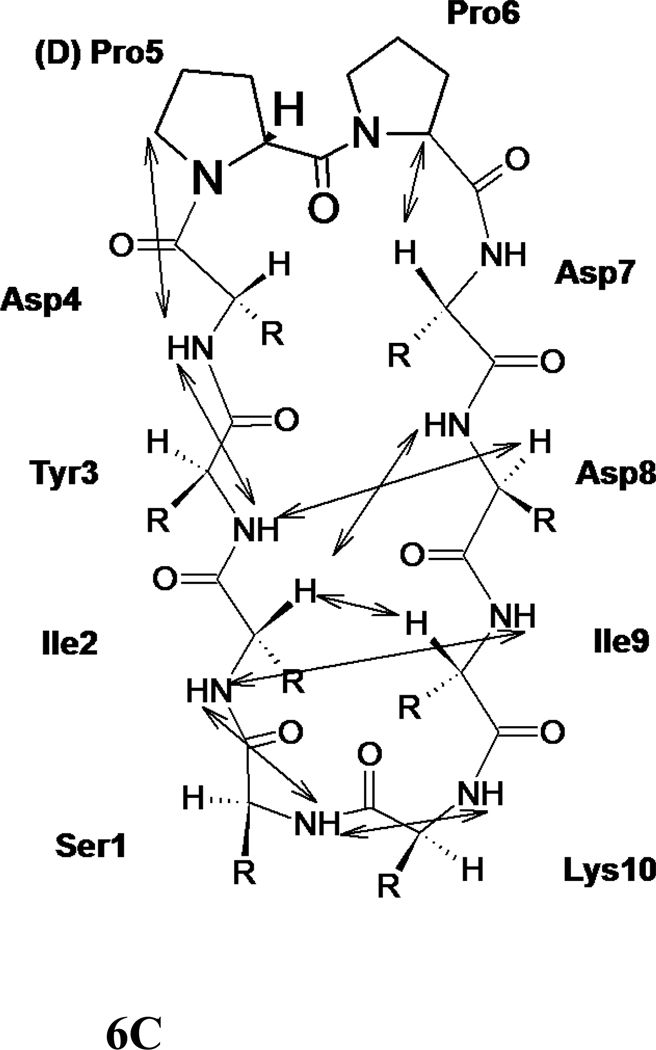
Figure 6.
500MHz 2D NMR data for peptide 6. A) NH-aliphatic region of NOESY spectrum of peptide in 90% H2O/10%D2O at 298 K showing NH-CαH connectivity. Sequential as well as long-range connectivities are shown. B) NH-NH region of NOESY spectrum of peptide 6. C) Schematic diagram showing the NOESY connectivity indicating the β-strand or β-hairpin structure of the peptide in solution. Observed NOEs are shown by double-ended arrows.


