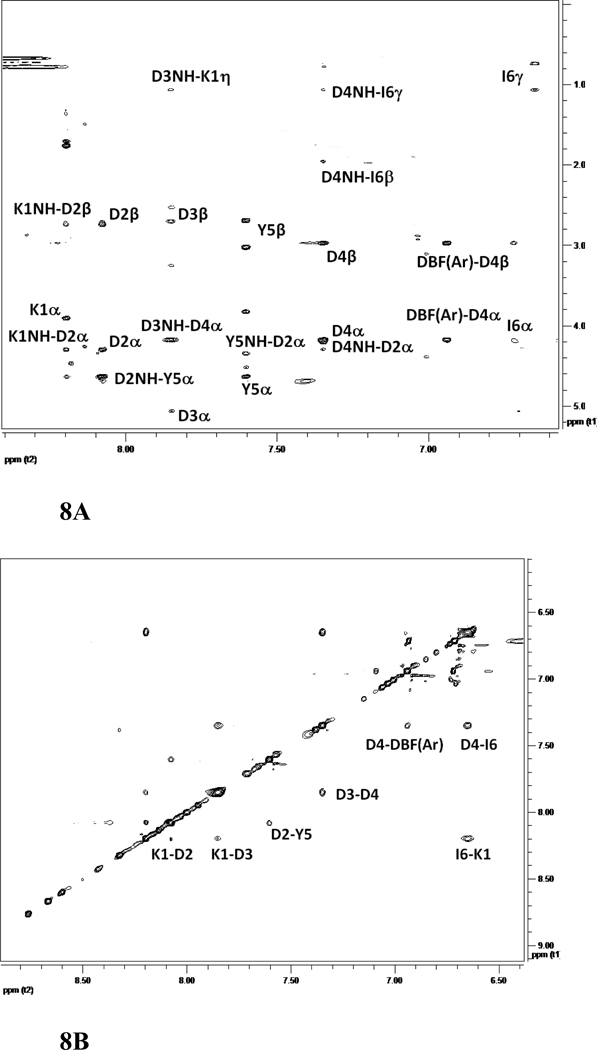
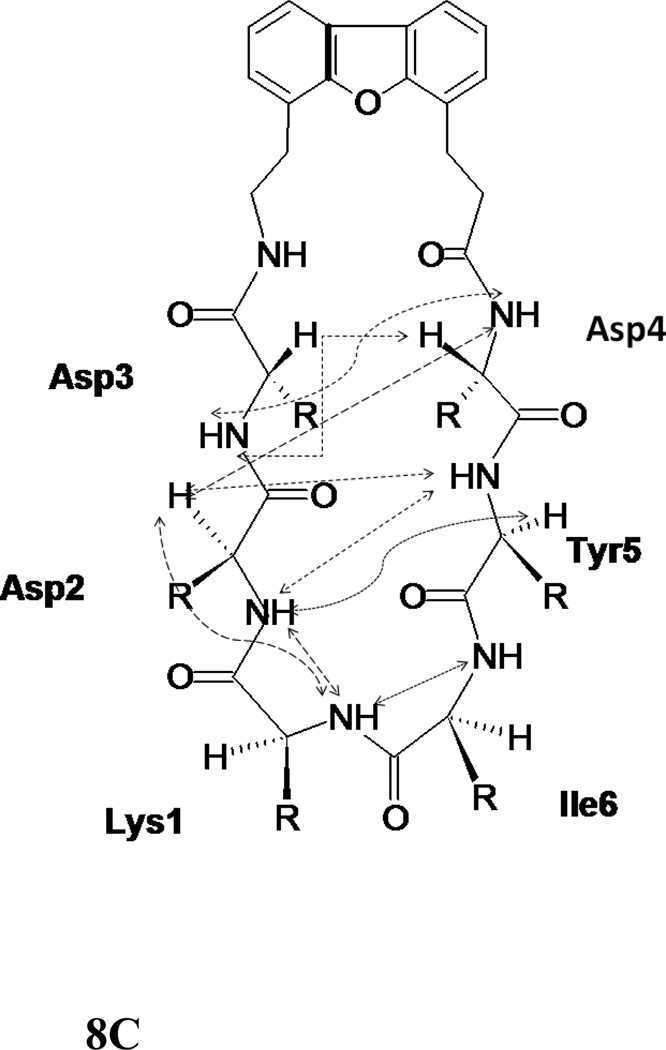
Figure 8.
500MHz 2D NMR data for the peptide 7. A) NH-aliphatic region of NOESY spectrum of peptide in DMSO-d6 at 298 K showing NH-CαH connectivity. Sequential as well as long-range connectivities are shown. B) NH-NH region of NOESY spectrum of peptide 7. C) Schematic diagram showing the NOESY connectivity indicating the β-strand or β-hairpin structure of the peptide in solution. Observed NOEs are shown by dotted lines.


