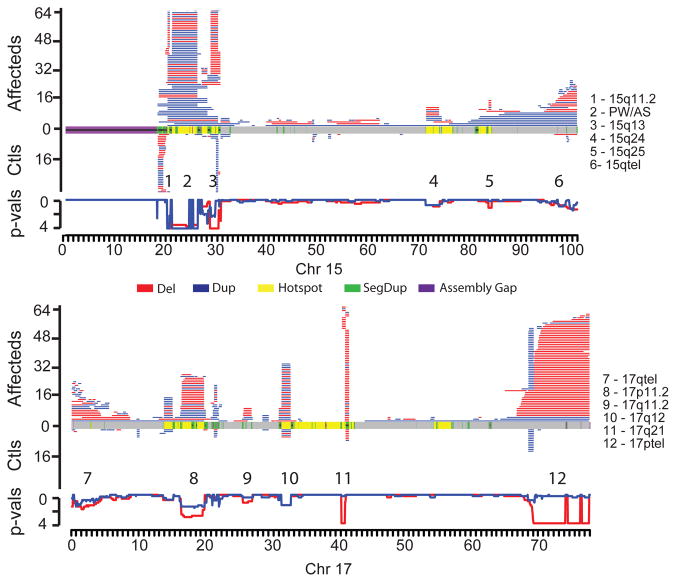
Figure 2. Maps of CNV locations for chromosomes 15 (top) and 17 (bottom).
CNVs (>400 kbp) in affected individuals are shown in the upper portion for each chromosome with control CNVs shown in the lower portion. Disease enrichment p-values are plotted just below the control CNV maps, computed in 200 kbp windows along each chromosome (step size of 50 kbp). Deletions and duplications are red and blue, respectively, with the p-value wiggle plots colored accordingly and plotted on a negative log scale. In the middle of each plot, chromosomal features are colored as depicted. Significantly enriched regions are numbered and named on the right-hand side.

