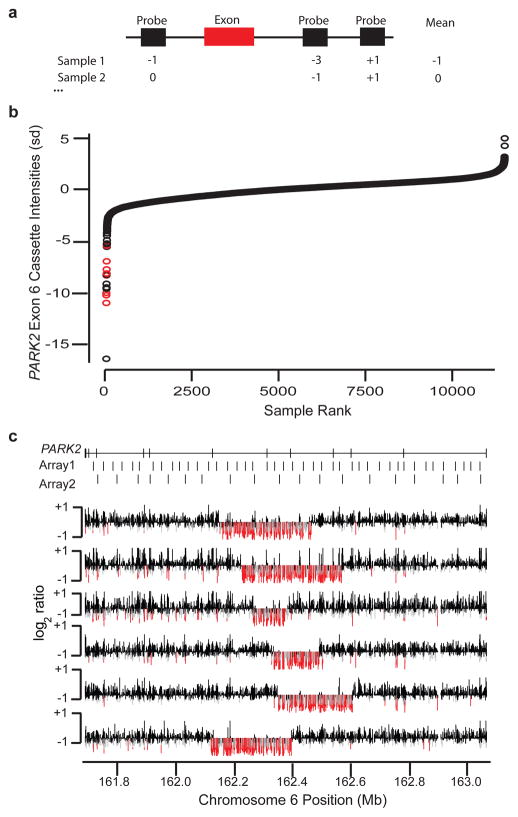
Figure 4. Discovery of novel, exon-altering CNVs using the Signature CGH data.
(A) For each coding exon (red bar), the three probes (black rectangles) nearest the exon for any given individual are used to define a cassette score. (B) Distribution of cassette intensities for exon 6 of PARK2 are sorted from lowest to highest (measured in standard deviations, Y-axis) across all samples (X-axis). Red points correspond to known, large deletion events that span the exon. (C) Validation results for the most strongly negative samples from (B) not previously known to carry deletions. Log2 ratio values (Y-axis for each individual row) for PARK2 (coordinates on the X-axis) in each of six tested samples are shown. Probes with very low intensities (< −0.5) are colored red, while those with moderately low values (< −0.3) are gray. Locations of PARK2 exons and probes on two of the most commonly used original oligonucleotide arrays are shown at the top.

