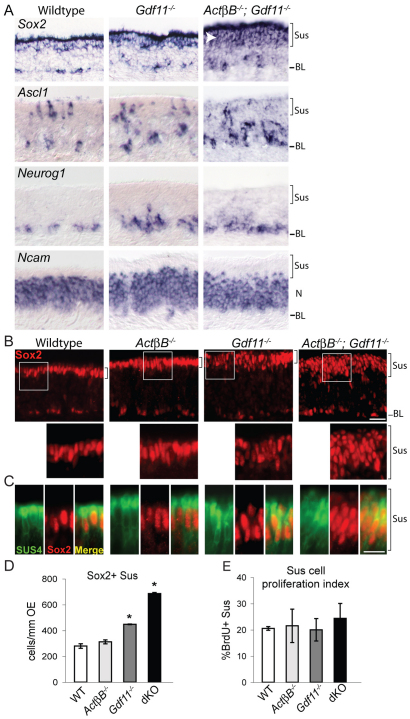
Fig. 5.
Increased Sus cells in Gdf11–/– and ActβB–/–;Gdf11–/– OE. (A) ISH with the indicated probes indicates increased Sox2 expression and a thicker Sus layer (white arrowhead) in ActβB–/–;Gdf11–/– OE. (B) Magnified images show apical SOX2+ cells outlined by white boxes. (C) Most apical SOX2+ cells are also SUS4+ [83±2% (±s.e.m.)]. (D) Mean number of SOX2+ Sus cells/mm OE (± s.e.m.; *, P≤0.05 DT). (E) SOX2+ Sus cells and the percentage of these that are BrdU+ (`proliferation index') plotted as mean ± s.e.m. dKO, ActβB–/–;Gdf11–/–. BL, basal lamina; N, neuronal layer; Sus, sustentacular layer. Scale bars: 20 μm in A,B; 10 μm in C.

