Fig. 1.
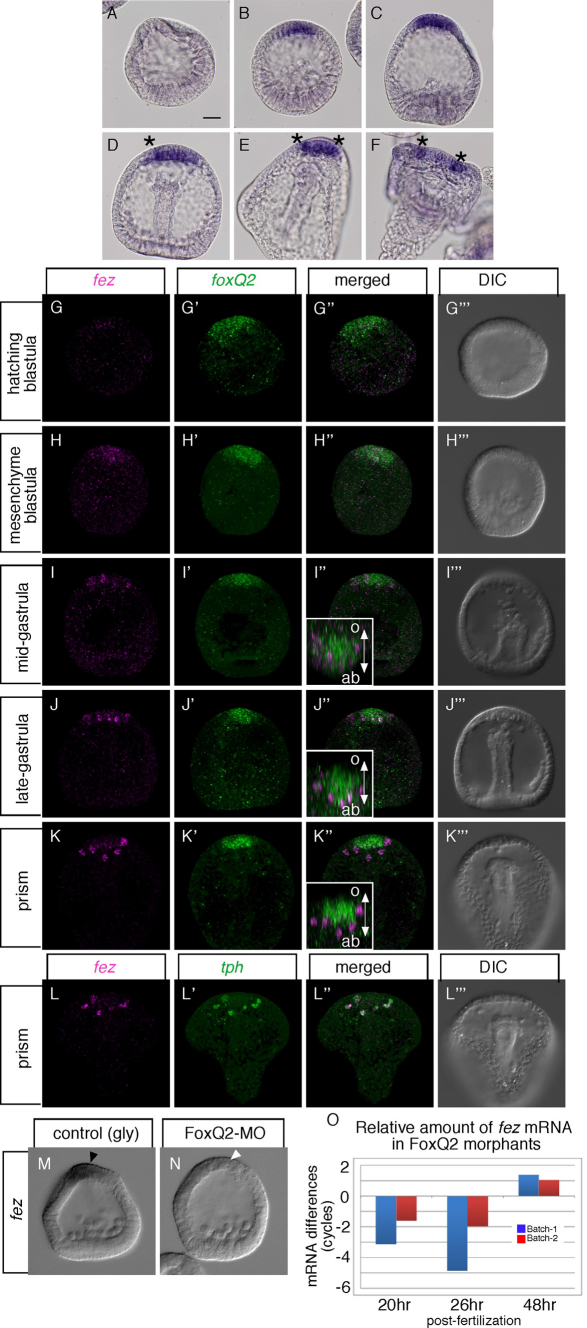
fez is expressed throughout the animal plate during the hatched and mesenchyme blastula stages and later in the serotonergic neurons. (A-F) Expression of fez in Hemicentrotus pulcherrimus at the unhatched blastula (A), mesenchyme blastula (B), early gastrula (C), mid-late gastrula (D), prism larva (E) and pluteus (F) stages. Asterisks in D-F show the individually stained cells. (G-H′′) fez is co-expressed in the animal plate with foxQ2 at blastula stages. (I-K′′) By contrast, at gastrula and prism stages, fez is expressed in individual cells that do not express foxQ2. Insets in I′, J′ and K′ show animal pole views of each image digitally rotated to show the asymmetry of foxQ2 and fez patterns along the secondary axis (o and ab show oral and aboral side, respectively). (L-L′′) The pattern of later expression of fez is identical to that of tph, which marks serotonergic neurons. (M-O) fez expression depends on FoxQ2. (M) fez is expressed in the animal plate region of control (gly; glycerol-injected) mesenchyme blastula-stage embryos (black arrowhead). (N) FoxQ2 morphant (FoxQ2-MO) lacks fez expression (white arrowhead). (O) Quantitative PCR (QPCR) shows that fez expression depends on FoxQ2 at early stages (20 hours, hatching-mesenchyme blastula; 26 hours, gastrula), but not at a later stage (48 hours; pluteus). x-axis shows time after fertilization. y-axis shows ΔΔCt, the cycle differences after normalization for load between experimental and control embryos (one negative cycle difference means that the mRNA concentration is reduced twofold). QPCR was performed by following the method described previously (Yaguchi et al., 2010b). Scale bar: 20 γm.

