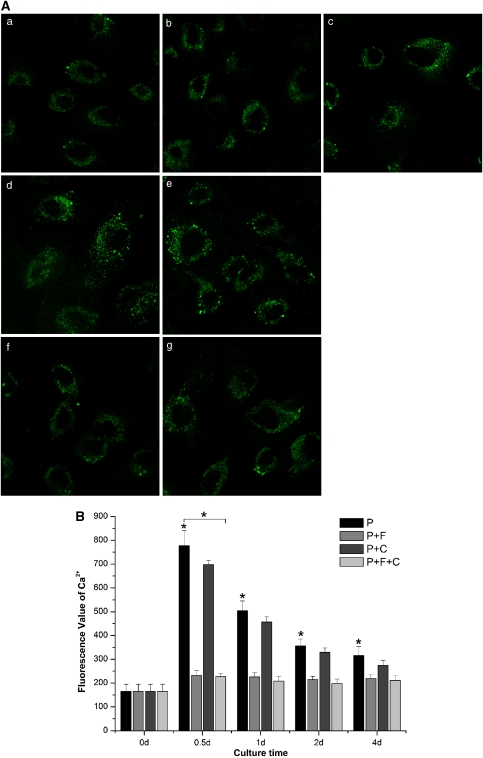
Figure 3.
The changes of the lipofuscin autofluorescence intensity in RPE cells fed with POSs. (A) The lipofuscin autofluorescence images recorded by LSCM ( × 600). (a) RPE cells cultured with normal medium. (b–e) The cells fed with POS for 12 h, 1, 2, and 4 days, respectively. (f–g) The cells fed with POS and treated with both of flunarizine and centrophenoxine for 12 h, 1, and 4 days, respectively. (B) Quantification of lipofuscin autofluorescence intensity in RPE cells. There is significantly statistical difference between controls (0 day) and cells fed with POS at 4 days (*P<0.01, n=3), and in cells treated with P+F+C compared with cells only fed with POS at 4 days (*P<0.01, n=3). P, the cells fed with POS. P+F, the cells cultured with POS and flunarizine. P+C, RPE cells cultured with POS and centrophenoxine. P+F+C, RPE cells fed with POS and treated with both of flunarizine and centrophenoxine.

