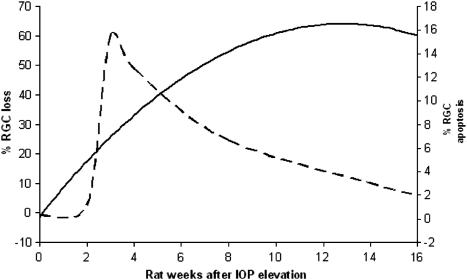
Figure 2.
The profile of RGC loss (bold line) and RGC apoptosis (dashed line) has been clearly documented in the rat OHT model of experimental glaucoma, and is shown above. Note the level of peak RGC apoptosis is at 3 weeks after elevated IOP, whereas maximal levels of RGC loss occur well after that, suggesting that RGC apoptosis is an early marker of disease.

