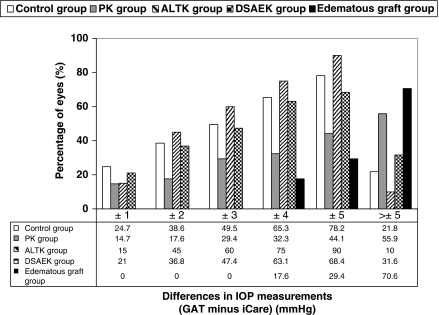
Figure 1.
Frequency histogram of the differences in IOP measurements between GAT and iCare. The histogram shows the percentage of eyes falling within different intervals of differences in IOP measurement between GAT and iCare (GAT minus iCare) in subjects with normal corneas (control group), patients after penetrating keratoplasty (PK group); patients after automated-lamellar-therapeutic keratoplasty (ALTK group), patients after Descemet-stripping-automated-endothelial keratoplasty (DSAEK group), and patients after keratoplasty with corneal edema (edematous grafts group).

