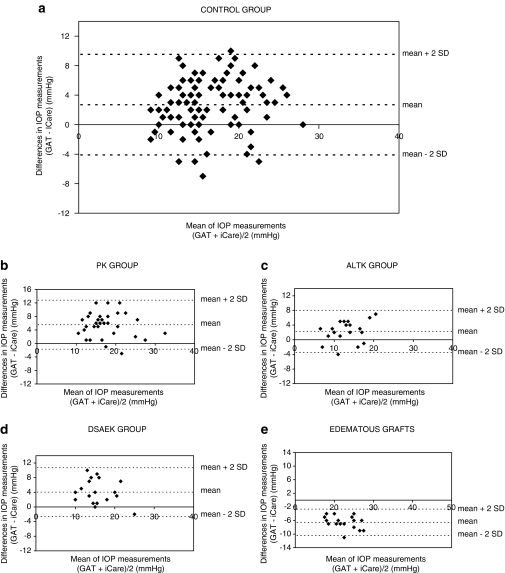
Figure 2.
Bland–Altman plots of the agreement between GAT and iCare IOP measurements. The plot shows the distribution of ΔIOP (GAT-iCare) (y axis) against the mean IOP value of the tonometers (x axis) for each measured eye in subjects with normal corneas ((a) control group), patients after penetrating keratoplasty ((b) PK group), patients after automated-lamellar-therapeutic keratoplasty ((c) ALTK group), patients after Descemet-stripping-automated-endothelial keratoplasty ((d) DSAEK group), and patients after keratoplasty with corneal edema ((e) edematous grafts group).

