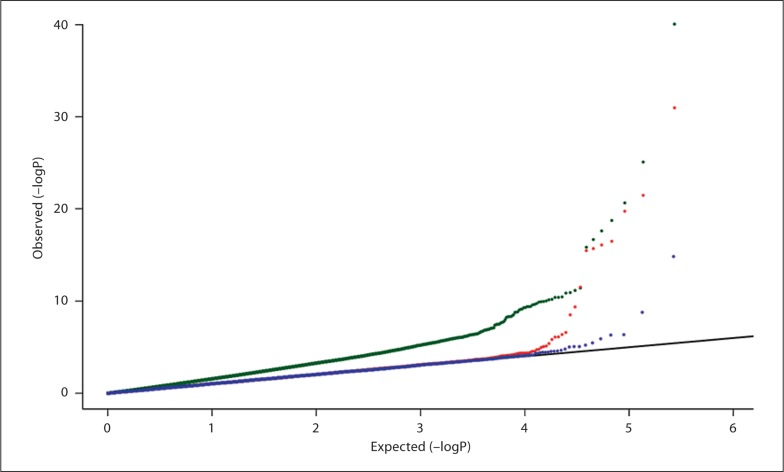
Fig. 3.
Quantile-quantile plot of GWAS of pancreatic cancer cases with additional controls. At a 20: 1 control:case ratio, this plot compares the association statistics without any population stratification correction (green), after correction with principal components analysis (red), or with both PCA and removal of SNPs that show differences between the MSKCC controls and additional controls (blue). The black line shows the expected result under the null hypothesis of no association.

