
Figure 10.
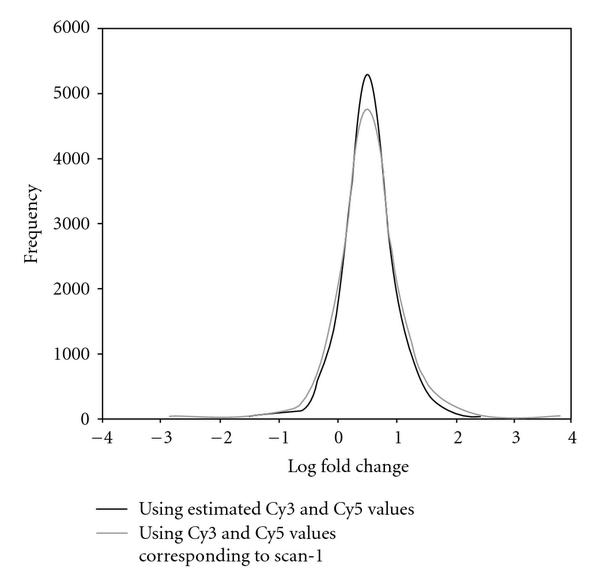
Comparison of the histograms of the log fold change corresponding to the scan-1 data (shown in grey) and the estimated posterior median (Cy3, Cy5) (shown in black).
Official websites use .gov
A
.gov website belongs to an official
government organization in the United States.
Secure .gov websites use HTTPS
A lock (
) or https:// means you've safely
connected to the .gov website. Share sensitive
information only on official, secure websites.
Comparison of the histograms of the log fold change corresponding to the scan-1 data (shown in grey) and the estimated posterior median (Cy3, Cy5) (shown in black).