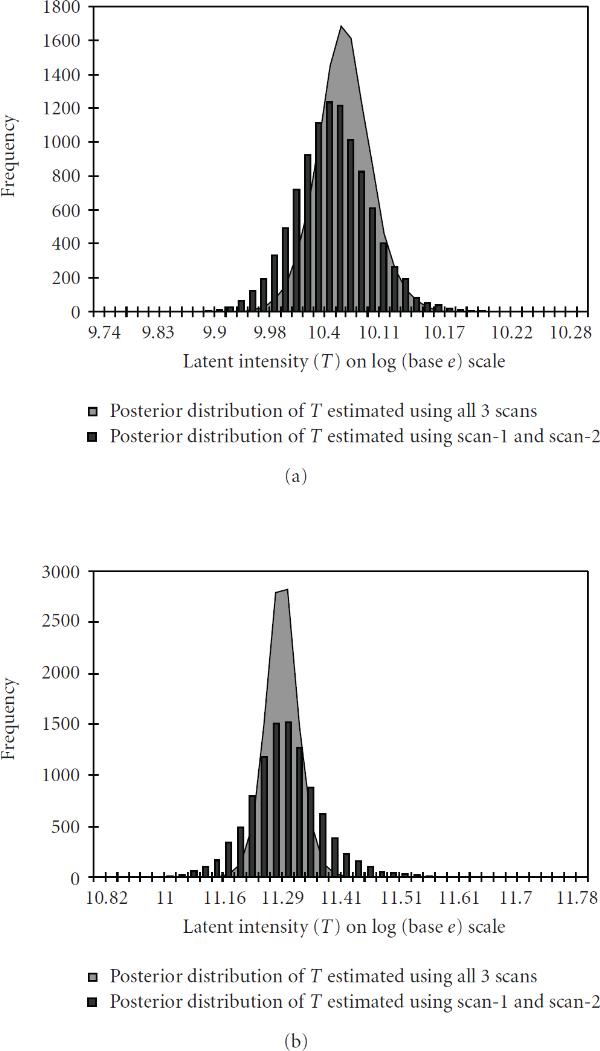
Figure 3.
Posterior distribution of the latent variable  for two genes obtained using all three scans (shown in grey) and using only two scans (scan-1 and scan-2, shown in black bars). The observation from "scan-1, scan-2, scan-3" for the genes are (a) (left-above) 10.51, 9.88, 9.08 and (b) (right-above) 11.01, 10.88, 10.50. (Different representations have been used to enhance the visibility.)

