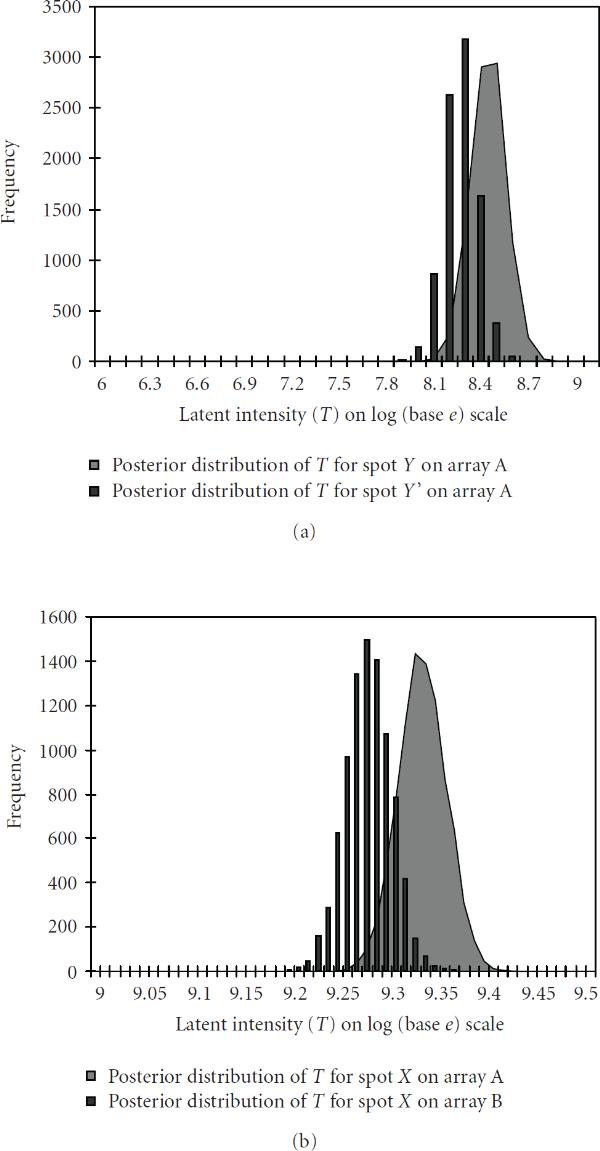
Figure 4.
Posterior distribution of true latent intensity for replicated spots on (a) (left-above) the same array A (b) (right-above) different arrays (array  and array
  ). The replicated spots
  and
and  had "scan-1, scan-2, scan-3" measurements as 8.35, 8.26, 8.02 and 8.32, 7.94, 7.76, respectively, on array
  , and spot
  had measurements 9.31, 9.23, 8.97 on array
  and measurements 9.27, 9.17, 8.87 on array
  . (Different representations have been used to enhance visibility.)

