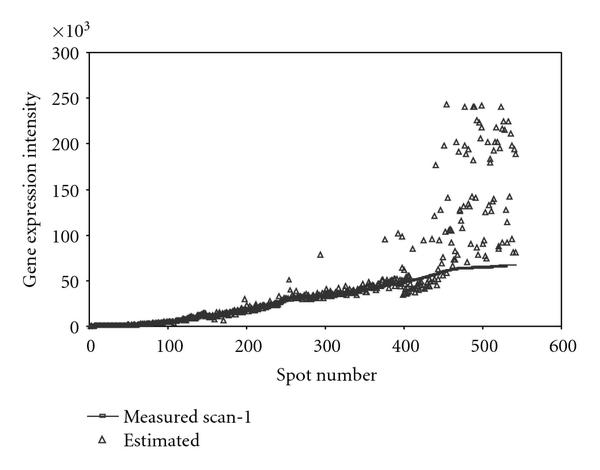
Figure 5.

This plot demonstrates the relashionship between the estimates of the latent intensities (on natural scale, for data from Cy3 channel) and the measurements from scan-1 over the range [200, 65 535] for 530 spots. The intensities are sorted in an ascending order according to scan-1 reading.
