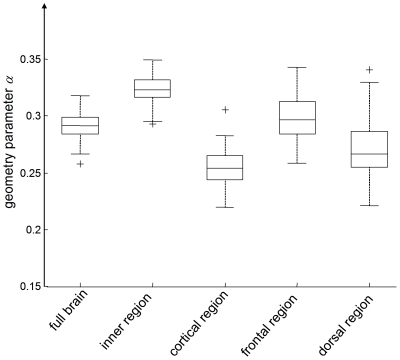
Figure 4. Regional variation in the parameter α representing the slope of the modulus dispersion  and
and  according to the springpot model.
As α is sensitive to the microstructure geometry of biological tissue it is named ‘geometry’ parameter. Similar to µ (Figure 3), all regional differences are statistically significant (p<0.001).

