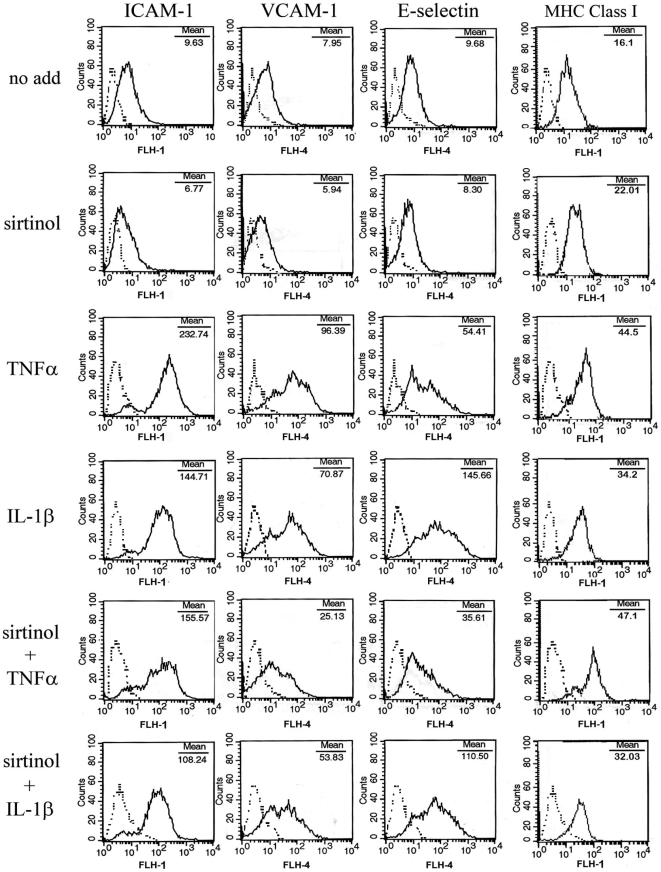
Figure 3. Expression of adhesion molecules in sirtinol-treated HDMEC after a 24-hour stimulation.
HDMEC were analyzed for ICAM-1, VCAM-1, E-selectin, and MHC Class I expression by flow cytometry after treatment with medium alone (no add) or sirtinol, followed by a 24-hour stimulation with the indicated cytokines. Dotted lines represent staining with matched isotype Ig. The x-axis and the y-axis indicate the relative cell number and mean fluorescence intensity, respectively. Data are representative of at least twelve different experiments with similar results.

