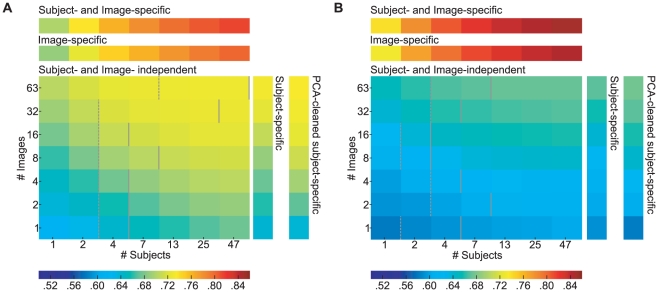
Figure 3. Estimation of lower and upper bounds for natural (A) and urban scenes (B).
All data shown are AUC values averaged over all predictions of single subjects on single images in a given parameter combination. The predictions are based on a spatial bias (large matrix, ‘Subject and Image independent’), a subject-specific bias (column next to the matrix, ‘Subject-specific’), a PCA-cleaned subject-specific bias (rightmost column), an image-specific bias (row above the matrix, ‘Image-specific’, also referred to as inter-subject consistency) and the combination of image and subject-specific bias (topmost row). The ‘Subject and Image independent’ scores depend on the number of subjects and images used for the prediction and represent a lower bound for fixation selection models. The ‘Image-specific’ scores also depend on the number of images and yield an upper bound for fixation selection models. Comparing ‘Subject-specific’ and Subject and Image independent reveals the effect of using a subject-specific bias. The dashed lines indicate at what subject group size the subject-specific bias stops being significantly better than the spatial bias (paired t-test,  ). The subject-specific bias is not significantly different from the spatial bias between the dashed and solid lines. See main text for more detailed descriptions.

