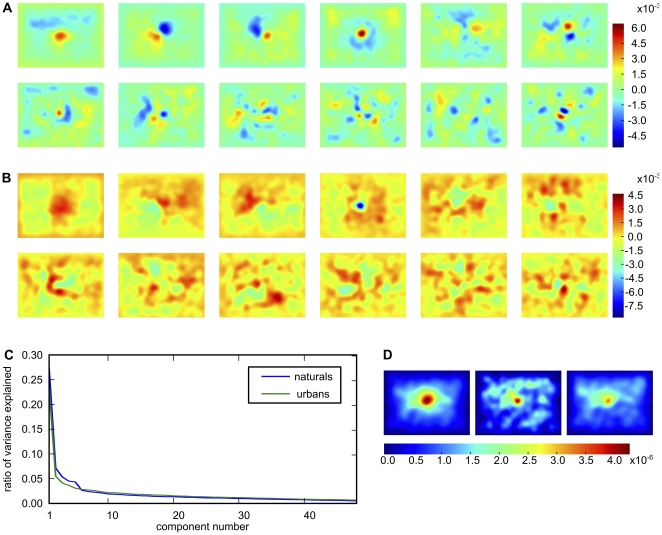
Figure 4. PCA-based cleaning of a subject-specific spatial bias.
Panels A and B show the first 12 principal components respectively for naturals and urbans. For demonstration purposes, the underlying subject biases were computed with fixation data from all images and all subjects. Please note that the sign of the principal components is arbitrary. Panel C shows that the variance explained by each component drops dramatically. This, and the fact that the first 5 components carry some interpretable meaning, led us to choose the first five components for the cleaning of the subject-specific bias. Panel D shows an example of this. The left plot shows the spatial bias of all other subjects, the center one the subject-specific bias and the right plot shows the result of reconstructing the subject-specific bias with the first five principal components.

