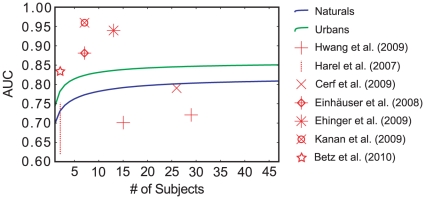
Figure 7. A comparison of inter-subject consistency AUC in different studies.
Green and blue lines show the dependence of inter subject consistency on the number of subjects in our data. The symbols show inter-subject consistency values reported in other studies. All studies that reported higher values used either stimuli that contained a wealth of high-level information or employed a specific task. Cerf et al. [12] also use a free viewing task and are compatible with our findings. Harel et al. [17] only report a range of values (read from a figure). Notably, Hwang et al. [13] use image rotations to diminish top-down influences and observe lower inter-subject consistency.

