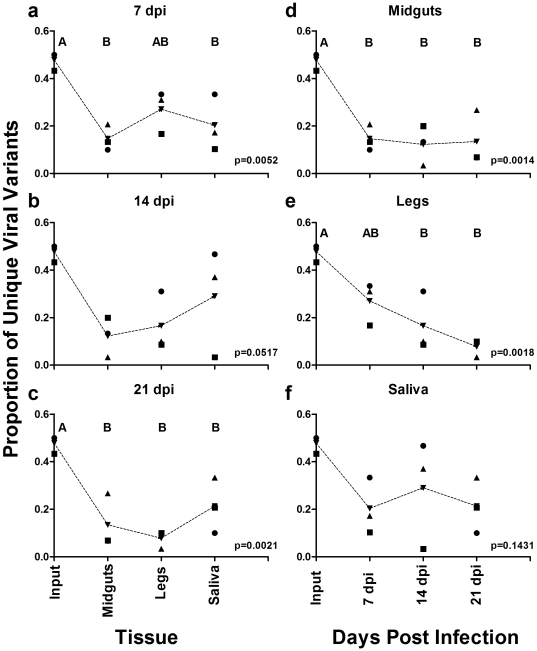
Figure 2. Proportion unique viral variants by time and tissue.
The proportion of unique viral variants was determined for each sample and plotted by either days post infection (7 dpi (A), 14 dpi (B), & 21 dpi (C)) or by tissue type (midguts (D), legs (E), & saliva (F)). Dotted lines connect means for each sample set. P-values were determined by ANOVA using Tukey's multiple comparison post test. Letters above sample sets represent statistically significant groupings (p-value<0.05). Figures without letters denote that samples were not significantly different from one another.

